The
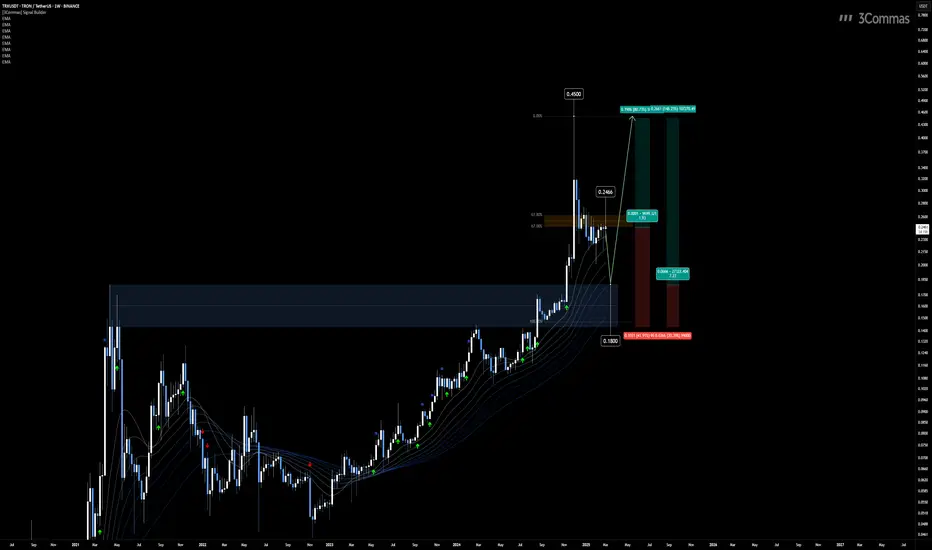
Two potential entry zones stand out for a continuation to the upside. The first is $0.2466, aligning with the golden Fibonacci retracement zone, a key level where buyers may step in. The second is $0.18, a significant support level where the price previously broke through a major historical high. Both areas offer favorable setups targeting $0.45, the next major resistance level.
The market’s reaction at these key levels will determine the next move. A strong bounce could confirm a continuation toward $0.45, while a breakdown of these supports could shift the momentum.
👨🏻💻💭 Which entry do you favor? Will TRX hold above $0.2466 or revisit $0.18 before its next leg up? Let’s discuss your outlook!
__
The information and publications within the 3Commas TradingView account are not meant to be and do not constitute financial, investment, trading, or other types of advice or recommendations supplied or endorsed by 3Commas and any of the parties acting on behalf of 3Commas, including its employees, contractors, ambassadors, etc.
🤖 It's time to trade smarter with 3Commas!!
📣 Sign up to get up to 25% off
👉 bit.ly/TradingView3Commas
📣 Sign up to get up to 25% off
👉 bit.ly/TradingView3Commas
Disclaimer
The information and publications are not meant to be, and do not constitute, financial, investment, trading, or other types of advice or recommendations supplied or endorsed by TradingView. Read more in the Terms of Use.