1. Key Observations from the Chart:
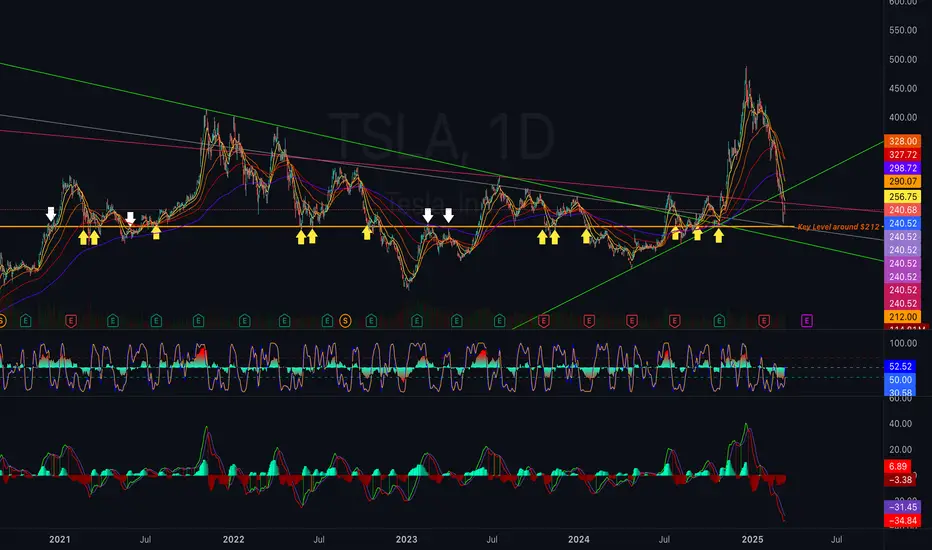
• Recent Selloff: TSLA has seen a significant decline from its recent high near $480 and is currently testing key support zones.
• Major Support & Resistance Levels Identified:
• Resistance Levels:
• $256.75 – Previously strong support, now acting as resistance.
• $290.07 – Another key resistance level (previous major pivot).
• $327.72 - $328.00 – Strong confluence zone, likely to reject price if tested.
• Support Levels:
• $240.68 – Testing this zone right now.
• $212.00 - Key Long-Term Support Zone (Highlighted on the chart, critical level).
• Below $212.00 could mean significant downside risk.
⸻
2. Trend Analysis & Chart Patterns
• Downtrend Confirmed: Price is clearly moving lower, with the 200-day EMA and trendlines confirming bearish pressure.
• Testing Key Support ($240.68): If this breaks, the next major support is around $212.00.
• Descending Resistance Line (Green Line) Could Act as Rejection If Price Bounces.
⸻
3. Indicator Analysis
Stochastic RSI (Middle Panel - Momentum Indicator)
• Currently near neutral levels (~52.52)
• Not oversold yet, meaning TSLA could still see more downside before a true bounce.
MACD (Bottom Panel - Trend & Momentum)
• Bearish MACD Cross Confirmed:
• MACD histogram is deeply negative, signaling strong selling momentum.
• No clear signs of reversal yet.
Note
4. Prediction for Tomorrow (March 14, 2025)
🔵 Bullish Scenario (If TSLA Holds $240 & Reclaims $256)
• Trigger: TSLA bounces off $240 and breaks $256 with strength
• Target 1: $256.75
• Target 2: $290.07
• Probability: Medium (needs strong buying volume).
🔴 Bearish Scenario (If TSLA Breaks Below $240.68 & Closes Below It)
• Trigger: TSLA falls under $240.68 and holds below
• Target 1: $212.00 (Key long-term support)
• Probability: High (Trend & momentum indicators suggest further downside).
Note
📊 How to Trade These Levels• Above Pivot ($250.75) → Bullish Bias:
• If TSLA breaks $256.75, expect a push toward $266.50.
• Trade idea: Buy Calls or Bullish Spreads.
• Below Pivot ($250.75) → Bearish Bias:
• If TSLA fails $240.68, expect a drop toward $231.20.
• Trade idea: Buy Puts or Bearish Spreads.
• If TSLA stays between $240 - $256 (Choppy Action):
• Consider Iron Condor or Credit Spreads for range-bound movement.
⸻
🚀 Pro Tip:
• Pre-Market Action: Watch how TSLA trades near $240.68.
• Opening Bell: If it reclaims $250, look for a breakout toward $256.
• Failure Below $240: Momentum could send TSLA toward $231 - $212 quickly.
TSLA Options Trade Recommendations for March 14, 2025
(Based on real-time pivot levels and expected price action)
⸻
🚀 Bullish Trade Ideas (If TSLA Holds Above $250 & Breaks $256)
1. 0DTE Call Option (High Risk, High Reward)
• Buy TSLA $260 Call (Exp. 3/14)
• Entry: If TSLA breaks above $256.75 and holds
• Exit Target: $266-$270
• Stop-Loss: If TSLA falls back below $250
2. Bull Call Spread (Lower Risk)
• Buy TSLA $255 Call (Exp. 3/14)
• Sell TSLA $265 Call (Exp. 3/14)
• Max Profit if TSLA closes above $265
3. Sell a Bull Put Spread (Credit Strategy)
• Sell TSLA $250 Put
• Buy TSLA $245 Put
• Profit if TSLA stays above $250
⸻
🔻 Bearish Trade Ideas (If TSLA Breaks Below $240.68 & Momentum Continues)
1. 0DTE Put Option (High Risk, High Reward)
• Buy TSLA $235 Put (Exp. 3/14)
• Entry: If TSLA breaks below $240.68
• Exit Target: $231 or lower
• Stop-Loss: If TSLA reclaims $245
2. Bear Put Spread (Safer Play)
• Buy TSLA $240 Put (Exp. 3/14)
• Sell TSLA $230 Put (Exp. 3/14)
• Max Profit if TSLA closes below $230
3. Sell a Bear Call Spread (Credit Strategy)
• Sell TSLA $255 Call
• Buy TSLA $260 Call
• Profit if TSLA stays below $255
⸻
⚖️ Neutral Strategy (If TSLA Stays Between $240-$256)
Iron Condor (Best for Low Volatility)
• Sell TSLA $265 Call
• Buy TSLA $270 Call
• Sell TSLA $235 Put
• Buy TSLA $230 Put
• Profit if TSLA stays between $235-$265
⸻
Final Trade Plan for Tomorrow (3/14/2025)
• Bullish 🟢 → Enter calls or bull spreads if TSLA breaks $256.75.
• Bearish 🔴 → Enter puts or put spreads if TSLA breaks below $240.68.
• Choppy/Sideways ⚖️ → Consider an Iron Condor or Credit Spreads.
As always, please let me know if you see something I didn't catch.
Disclaimer
The information and publications are not meant to be, and do not constitute, financial, investment, trading, or other types of advice or recommendations supplied or endorsed by TradingView. Read more in the Terms of Use.
As always, please let me know if you see something I didn't catch.
Disclaimer
The information and publications are not meant to be, and do not constitute, financial, investment, trading, or other types of advice or recommendations supplied or endorsed by TradingView. Read more in the Terms of Use.