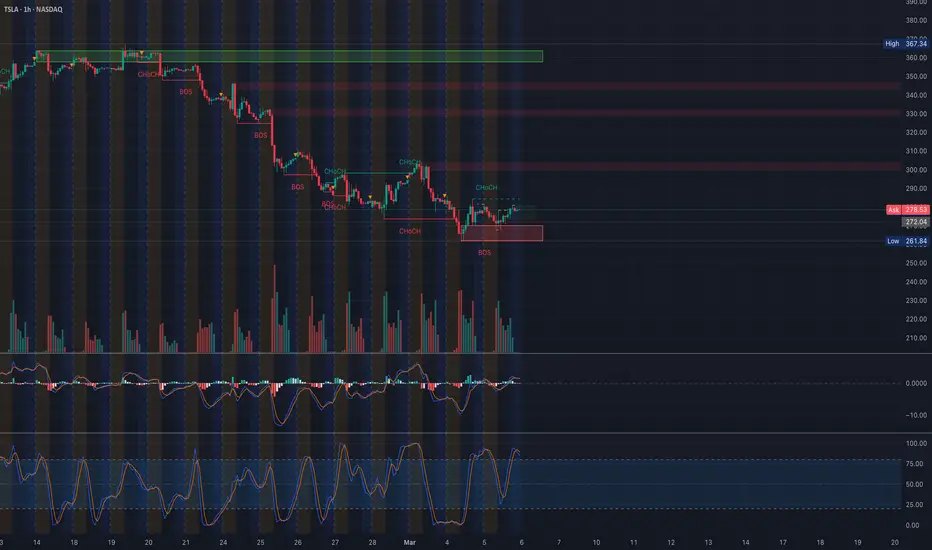
Market Structure & Key Levels
* Current Price: $278.53
* Support: $265, $250
* Resistance: $292.5, $300, $310
TSLA has recently rebounded from a demand zone around $265, showing early signs of a potential reversal. Multiple Change of Character (ChoCH) shifts indicate a possible transition from a bearish to a bullish market structure.
Reversal Zone Analysis
TSLA has entered a potential reversal zone between $278 - $292.5. If price sustains above $278, upside momentum toward $300 and $310 could unfold. A failure to hold $278 could send it back to retest the $265 support level.
Options & GEX Analysis

* IVR: 84.1
* IVx Avg: 80.3
* GEX: Green (bullish positioning)
* Put Walls: $265, $250
* Call Walls: $292.5, $300, $310
Options flow indicates bullish sentiment, with increasing call interest above $292.5 and strong put support at $265.
Trading Plan & Strategy
Bullish Scenario (Preferred)
* Entry: Above $278 with strong volume confirmation
* Target: $292.5, then $300
* Stop-Loss: Below $272
Bearish Scenario (Less Likely)
* Entry: If price rejects the $292.5 - $300 zone
* Target: $265
* Stop-Loss: Above $295
Options Trade Idea
* Bull Call Spread: Buy $280 Calls, Sell $300 Calls (April Expiry)
* Credit Put Spread: Sell $270 Puts, Buy $260 Puts
Final Thoughts
TSLA is showing early signs of a reversal, but needs to hold above $278 for confirmation. Watch for strength toward $292.5 and $300. If price struggles at resistance, a retest of $265 is possible.
Disclaimer:
This analysis is for educational purposes only and not financial advice. Please do your own research and manage risk accordingly.
* Current Price: $278.53
* Support: $265, $250
* Resistance: $292.5, $300, $310
TSLA has recently rebounded from a demand zone around $265, showing early signs of a potential reversal. Multiple Change of Character (ChoCH) shifts indicate a possible transition from a bearish to a bullish market structure.
Reversal Zone Analysis
TSLA has entered a potential reversal zone between $278 - $292.5. If price sustains above $278, upside momentum toward $300 and $310 could unfold. A failure to hold $278 could send it back to retest the $265 support level.
Options & GEX Analysis
* IVR: 84.1
* IVx Avg: 80.3
* GEX: Green (bullish positioning)
* Put Walls: $265, $250
* Call Walls: $292.5, $300, $310
Options flow indicates bullish sentiment, with increasing call interest above $292.5 and strong put support at $265.
Trading Plan & Strategy
Bullish Scenario (Preferred)
* Entry: Above $278 with strong volume confirmation
* Target: $292.5, then $300
* Stop-Loss: Below $272
Bearish Scenario (Less Likely)
* Entry: If price rejects the $292.5 - $300 zone
* Target: $265
* Stop-Loss: Above $295
Options Trade Idea
* Bull Call Spread: Buy $280 Calls, Sell $300 Calls (April Expiry)
* Credit Put Spread: Sell $270 Puts, Buy $260 Puts
Final Thoughts
TSLA is showing early signs of a reversal, but needs to hold above $278 for confirmation. Watch for strength toward $292.5 and $300. If price struggles at resistance, a retest of $265 is possible.
Disclaimer:
This analysis is for educational purposes only and not financial advice. Please do your own research and manage risk accordingly.
Disclaimer
The information and publications are not meant to be, and do not constitute, financial, investment, trading, or other types of advice or recommendations supplied or endorsed by TradingView. Read more in the Terms of Use.
Disclaimer
The information and publications are not meant to be, and do not constitute, financial, investment, trading, or other types of advice or recommendations supplied or endorsed by TradingView. Read more in the Terms of Use.