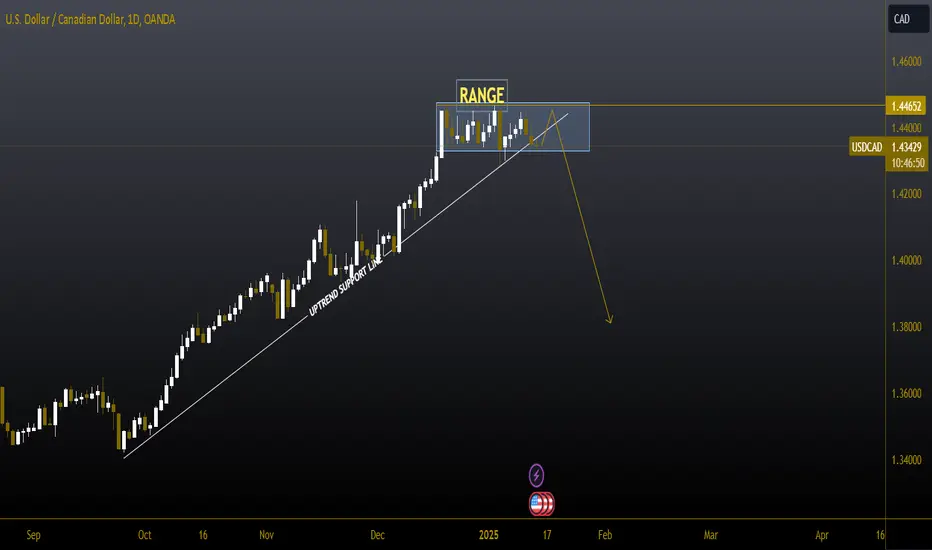
USDCAD (1D Timeframe) Analysis
Market Structure:
The price was supported by a trendline, but after forming a consolidation range near this Resistance, it has broken down, indicating potential bearish momentum. The breakdown suggests that the buyers were unable to hold the trendline, and selling pressure has increased.
Forecast:
A sell opportunity is anticipated as the breakdown below the trendline and range indicates a shift in market sentiment toward the downside.
Key Levels to Watch:
- Entry Zone: Consider entering a sell position after a retest of the broken trendline or consolidation range as resistance.
- Risk Management:
- Stop Loss: Placed above the retest level or recent swing high to manage risk.
- Take Profit: Target the next support levels or Fibonacci retracement areas for potential downside targets.
Market Sentiment:
The breakdown of the trendline support signals bearish sentiment, with further downside likely if the price remains below the retest level. Proper confirmation is recommended before entering the trade.
✅ Discover my trading strategies signals educational resources 👇
t.me/+COYsInxWoMg1OTg8
✅Join my recommended broker World best broker 👇
one.exnesstrack.net/a/negkxt6hhx
✅ Facebook 👇
facebook.com/thepipsfighter
t.me/+COYsInxWoMg1OTg8
✅Join my recommended broker World best broker 👇
one.exnesstrack.net/a/negkxt6hhx
✅ Facebook 👇
facebook.com/thepipsfighter
Disclaimer
The information and publications are not meant to be, and do not constitute, financial, investment, trading, or other types of advice or recommendations supplied or endorsed by TradingView. Read more in the Terms of Use.
