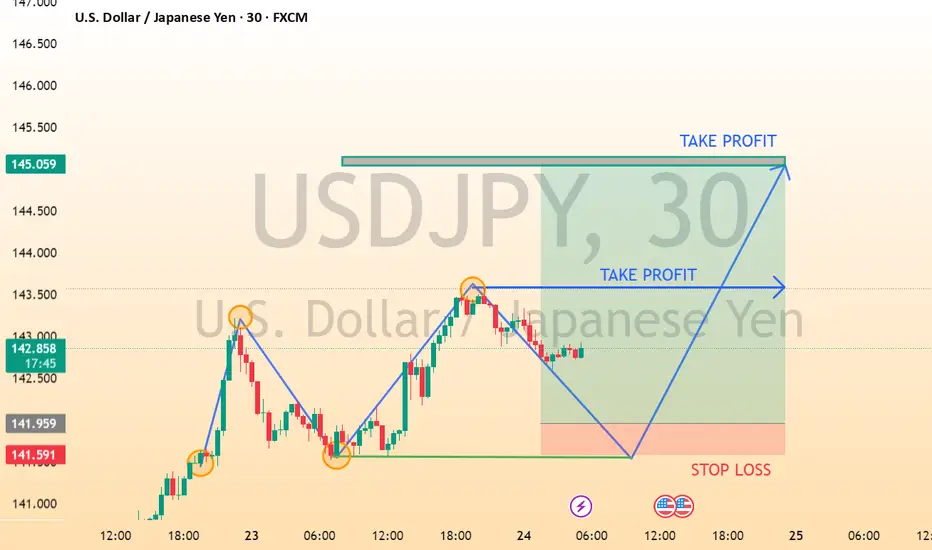
This chart shows a potential "W" or double-bottom pattern forming on the USD/JPY 30-minute timeframe, indicating a possible bullish reversal setup.
Key observations:
Pattern Setup: The "W" pattern suggests price might retest the previous low and then bounce up.
Entry Zone: The potential buy zone is near the bottom of the right leg of the "W" (around the green support line).
Stop Loss: Positioned just below the recent low to manage risk.
Take Profit: Two targets are indicated:
The first around the middle horizontal resistance (interim TP).
The second at the previous swing high (full TP).
It looks like a long (buy) trade idea with a solid risk-reward ratio. Are you planning to enter this setup or just analyzing it for now?
Trade active
ACTIVE TRADE📲 Join telegram channel free ..
t.me/Money_Magnet08
Forex, Gold & Crypto Signals with detailed analysis & get consistent results..
t.me/Money_Magnet08
Gold Signal's with proper TP & SL for high profit opportunities..
t.me/Money_Magnet08
Forex, Gold & Crypto Signals with detailed analysis & get consistent results..
t.me/Money_Magnet08
Gold Signal's with proper TP & SL for high profit opportunities..
Disclaimer
The information and publications are not meant to be, and do not constitute, financial, investment, trading, or other types of advice or recommendations supplied or endorsed by TradingView. Read more in the Terms of Use.
📲 Join telegram channel free ..
t.me/Money_Magnet08
Forex, Gold & Crypto Signals with detailed analysis & get consistent results..
t.me/Money_Magnet08
Gold Signal's with proper TP & SL for high profit opportunities..
t.me/Money_Magnet08
Forex, Gold & Crypto Signals with detailed analysis & get consistent results..
t.me/Money_Magnet08
Gold Signal's with proper TP & SL for high profit opportunities..
Disclaimer
The information and publications are not meant to be, and do not constitute, financial, investment, trading, or other types of advice or recommendations supplied or endorsed by TradingView. Read more in the Terms of Use.