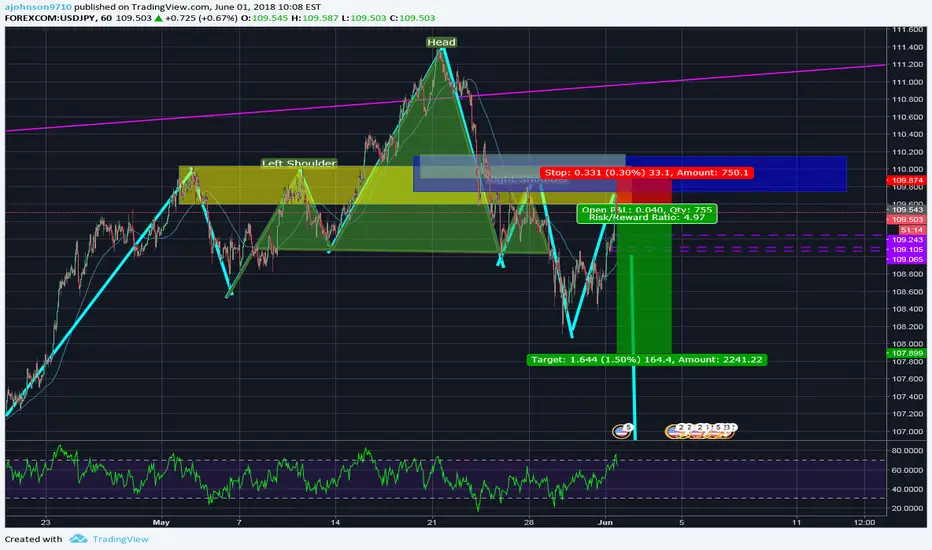
Head and shoulders break , although it failed its retest it hasn't yet broken the previous high.
The 3 boxes on the chart are areas based on Fibonacci retracement of 0.5-0.618 which are all overlapping with previous support/resistance.
with a double top on the 5 minute chart baring divergence to go with it;
A nice engulfing candle on the hour chart.
This entry is shy of the overlapping area based on the Fibonacci, however it looks as though it may react now, be careful and if needs be wait for the break of the neckline a second time!
stop loss is placed based on the assumption this is the new structure high.
Take profits is based on previous structure. Happy trading!!
Any questions or ideas go ahead and leave me a comment:)
Note
Price has just broken through a support line that has held for a few hours and broke on its 3rd/4th attempt.Expecting price to drop nicely from now, fingers crossed
Note
Price has made a triple top all with divergence on the hourly chart. On the current top the one hour candles have created some nice last gasp wicks to push higher, also with nice momentum losing curve so this could be the moment we see the market turn before the upcoming newsNote
A inverted head and shoulders pattern has just completed for for where standard profits for this pattern would be so more reason for this pair to begin its decline but as always the market has a mind of its ownTrade closed: stop reached
Disclaimer
The information and publications are not meant to be, and do not constitute, financial, investment, trading, or other types of advice or recommendations supplied or endorsed by TradingView. Read more in the Terms of Use.
Disclaimer
The information and publications are not meant to be, and do not constitute, financial, investment, trading, or other types of advice or recommendations supplied or endorsed by TradingView. Read more in the Terms of Use.