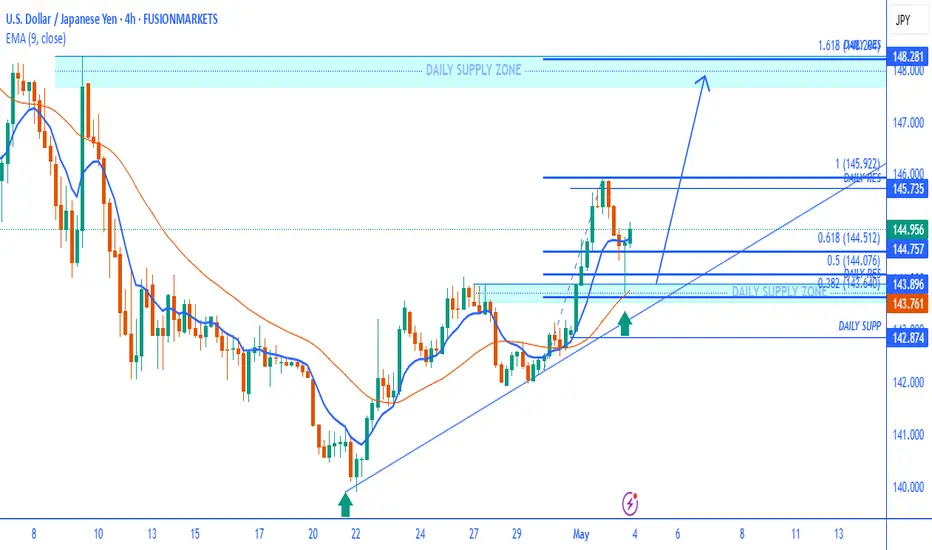
This is a 4-hour chart of the USD/JPY currency pair with a technical analysis setup that includes the following key elements:
Chart Analysis:
Trendline Support:
The price is following an ascending trendline, confirmed by higher lows (marked by green arrows).
The recent bounce off this trendline signals ongoing bullish momentum.
Key Levels & Zones:
Daily Supply Zone: Located around 147.80–148.30, which could act as a major resistance if price rallies.
Daily Resistance: At approximately 145.735, which price is approaching.
Daily Support: Around 142.87, reinforced by trendline confluence.
Fibonacci Retracement:
Fibonacci levels are drawn from the recent swing low to high:
0.382 ≈ 144.05
0.5 ≈ 144.07
0.618 ≈ 144.51
The price recently bounced from near the 0.618 retracement and is now climbing.
Moving Averages:
EMA 9 and EMA 21 are both sloping upward, with the 9 EMA (blue) currently at 144.757 and above the 21 EMA (orange), reinforcing a short-term bullish bias.
Bullish Scenario (highlighted by arrows):
If the price holds above the trendline and the 144.50–144.75 zone, a move toward 145.92 (previous high) is expected.
A break above 145.92 could lead to an extension toward 148.28 (1.618 Fib extension), coinciding with the supply zone.
Summary:
Current Bias: Bullish, as long as price respects the trendline and EMAs.
Confirmation for Continuation: A close above 145.735.
Invalidation: A sustained break below 143.75 or the trendline could shift the bias bearish.
Disclaimer
The information and publications are not meant to be, and do not constitute, financial, investment, trading, or other types of advice or recommendations supplied or endorsed by TradingView. Read more in the Terms of Use.
Disclaimer
The information and publications are not meant to be, and do not constitute, financial, investment, trading, or other types of advice or recommendations supplied or endorsed by TradingView. Read more in the Terms of Use.