Market sentiment has vastly improved over the past weeks, where news about the promising vaccine has also helped boost not only energy but also equity markets. Crude Oil futures prices continue to grow from the historic April lows as a combination of production cuts and signs of increasing demand appears to have stabilized the market in the near-term. Announcements of economies around the world releasing their lockdowns measures allowing more business to reopen are helping the sentiment on demand improving the current global glut of crude oil.
However, today’s Asian session started to face some selling pressures, where it could be only a technical correction after an intense week rally by the bulls claiming almost 14% of the ground. Or, the fear of investors by the political tensions caused by the escalation between the US and China over the possible decision that would be imposed by the Central Government in the mainland over the National Security Law on Hong Kong. The geopolitical tensions result in a risk-off tone causing some oil traders to close their long positions on profit.
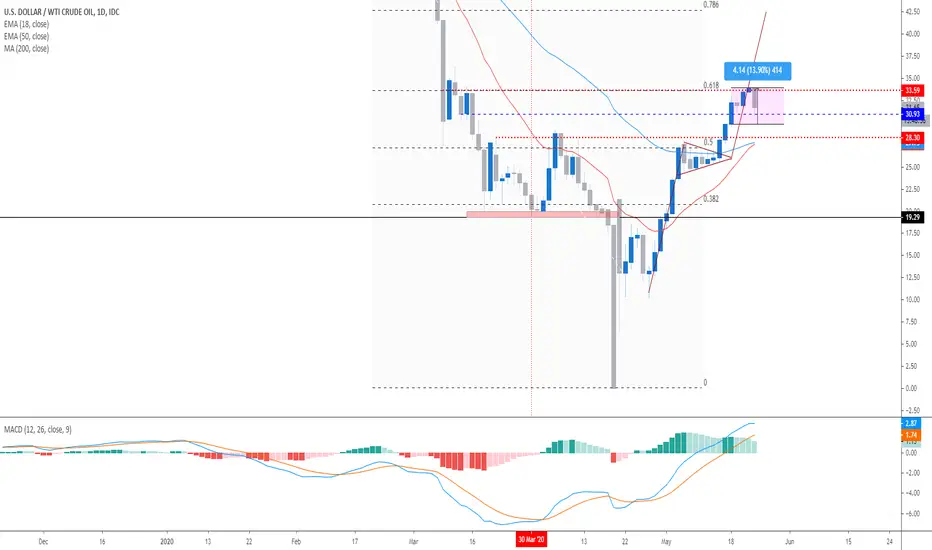
Now, reading the charts this week, the rally was able to take the oil price to touch the Fibonacci level around 0.618, where a technical correction was expected for a further uptrend continuation. 18 & 50 EMA are about to form a golden-cross supporting the bullish momentum in the market. MACD is already in a positive note with a bullish bias. Today’s candle shows how bears got a rejection from the support level at $30.93. With London about to open, let us see how the market close today.
Keep in mind that even with investors rattled by concerns of fresh unrest in Hong Kong and geopolitical tension building up, the oil market recovery cannot be ruled out, with reports indicating that Chinese oil demand is almost back to pre-virus levels is the crucial factor to reckon.
However, today’s Asian session started to face some selling pressures, where it could be only a technical correction after an intense week rally by the bulls claiming almost 14% of the ground. Or, the fear of investors by the political tensions caused by the escalation between the US and China over the possible decision that would be imposed by the Central Government in the mainland over the National Security Law on Hong Kong. The geopolitical tensions result in a risk-off tone causing some oil traders to close their long positions on profit.
Now, reading the charts this week, the rally was able to take the oil price to touch the Fibonacci level around 0.618, where a technical correction was expected for a further uptrend continuation. 18 & 50 EMA are about to form a golden-cross supporting the bullish momentum in the market. MACD is already in a positive note with a bullish bias. Today’s candle shows how bears got a rejection from the support level at $30.93. With London about to open, let us see how the market close today.
Keep in mind that even with investors rattled by concerns of fresh unrest in Hong Kong and geopolitical tension building up, the oil market recovery cannot be ruled out, with reports indicating that Chinese oil demand is almost back to pre-virus levels is the crucial factor to reckon.
FEEL FREE TO CHECK MY SOCIAL NETWORKS FOR MORE MARKET INFORMATION 🇺🇸 🇪🇸
INSTAGRAM:
instagram.com/og.fxtrader
FREE TELEGRAM:
t.me/ogfxtrader
TWITTER
twitter.com/ogfxtrader
FACEBOOK
facebook.com/ogfxtrader
INSTAGRAM:
instagram.com/og.fxtrader
FREE TELEGRAM:
t.me/ogfxtrader
twitter.com/ogfxtrader
facebook.com/ogfxtrader
Disclaimer
The information and publications are not meant to be, and do not constitute, financial, investment, trading, or other types of advice or recommendations supplied or endorsed by TradingView. Read more in the Terms of Use.