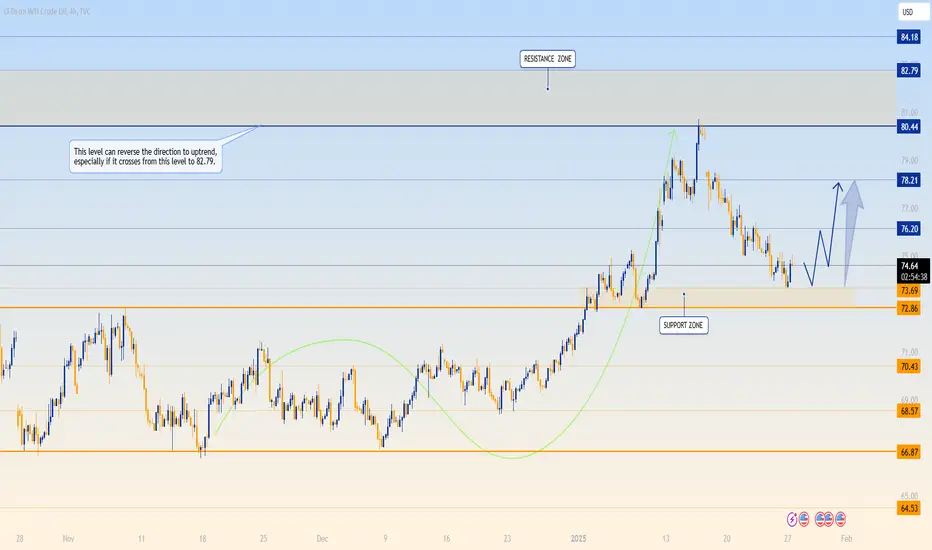
WTI Crude Oil Analysis (4H Chart)
The market is currently consolidating near the support zone marked between $72.86 and $73.69. This level has demonstrated its importance as a barrier to further downside movement, with price repeatedly rebounding from this area in recent sessions.
On the upside, the first key resistance level is seen at $76.20. A breakout above this level could pave the way for a bullish move toward $78.21. If momentum strengthens, the next significant hurdle would be $80.44, with the broader resistance zone extending up to $82.79 and $84.18.
The highlighted text in the chart suggests that a reversal to the uptrend may occur if the price successfully breaks through $82.79, signaling a potential shift in market sentiment.
At present, the market appears to be attempting to establish a short-term bottom. A bounce from the current levels could result in the price testing the resistance levels step by step. However, failure to hold the support zone could lead to further declines toward lower levels like $70.43 or $68.57.
Adding to the bearish sentiment, oil prices fell more than 1% on Monday following comments from U.S. President Trump, who called on OPEC to reduce prices. This followed the announcement of wide-ranging measures to boost U.S. oil and gas output during his first week in office. This pressure could weigh on the market, limiting any significant upward momentum in the short term.
Profit isn’t about luck, it’s about strategy. Get free signals and trade smarter: Telegram Channel [t.me/ArinaMarketAnalysis].
The market is waiting—you can make money, and you should.
The market is waiting—you can make money, and you should.
Disclaimer
The information and publications are not meant to be, and do not constitute, financial, investment, trading, or other types of advice or recommendations supplied or endorsed by TradingView. Read more in the Terms of Use.
