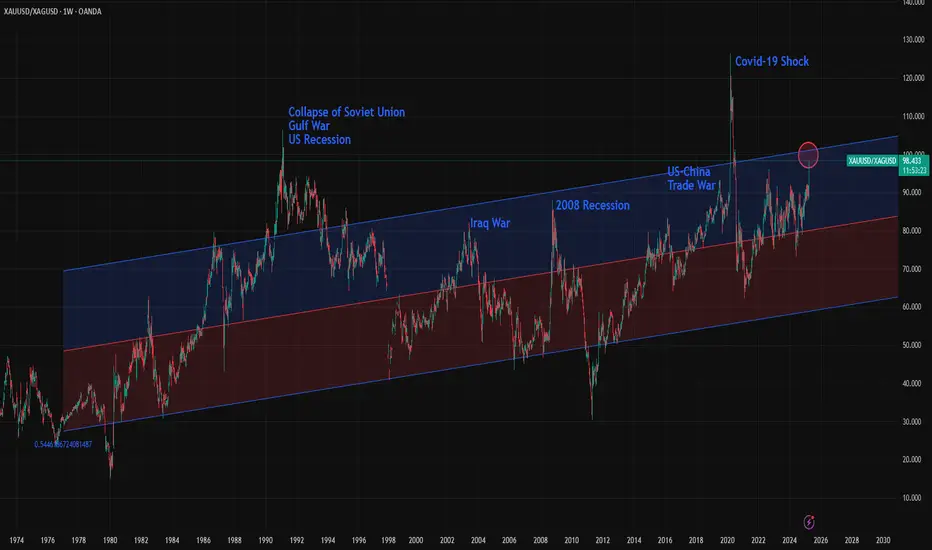
The Gold/Silver ratio is on the verge of reaching 100, an extremely rare level seen only at key historical turning points. The chart includes a 2,500-week linear regression channel, which shows that over the very long term, the ratio has been steadily rising, though at a slow pace. Occasionally, the ratio touches the 1.5 standard deviation line, and in rare, game-changing events, and sometimes it even breaks beyond that level.
Here are some of the key historical turning points marked by major spikes in the Gold/Silver ratio:
1- Early 1990s: The collapse of the Soviet Union, the Gulf War, and a U.S. recession pushed the ratio to 106. It remained above 1.5 standard deviations for more than two years.
2- 2002: Following the dot-com bubble burst, the 9/11 attacks, and the Iraq War, the ratio climbed to 82.6, nearing the 1.5 deviation line.
3- 2008 Recession: The global financial crisis triggered by the collapse of Lehman Brothers sent the ratio to 88.50. This spike sparked a major rally in both gold and silver, lasting until 2011 when the ratio reached one of its deepest bottoms.
4- 2019: The U.S.–China trade war under Trump’s first term pushed the ratio to 93, again nearing the 1.5 deviation threshold.
5- 2020 (COVID-19 Shock): The pandemic caused one of the biggest disruptions in modern economic history. Although relatively short-lived, its impacts were severe. The Gold/Silver ratio surged to 126, marking the highest level in modern records, possibly the highest in all of history.
6- 2024–2025 (Global Trade War?): With the U.S. imposing major tariffs on key global trading partners, this could be another historic inflection point. The full impact is still unfolding, but risks of a serious global slowdown, or even a deep recession are rising. A full-scale trade war remains a real possibility.
Now, the Gold/Silver ratio is approaching 100 and nearing the 1.5 standard deviation line. It remains unclear whether this represents a powerful pair trade opportunity—"sell gold, buy silver"—or a structural breakout where the ratio stays elevated for an extended period. In either case market is showing that this is one of the rare turning point of global economy.
Trade active
The ratio passed 100 and now it is over 1.5 standard deviation. This is the signal that we are in a big economic shift at the moment, and perhaps a "sell gold/buy silver" big trade oppurtunity is coming.Disclaimer
The information and publications are not meant to be, and do not constitute, financial, investment, trading, or other types of advice or recommendations supplied or endorsed by TradingView. Read more in the Terms of Use.
Disclaimer
The information and publications are not meant to be, and do not constitute, financial, investment, trading, or other types of advice or recommendations supplied or endorsed by TradingView. Read more in the Terms of Use.