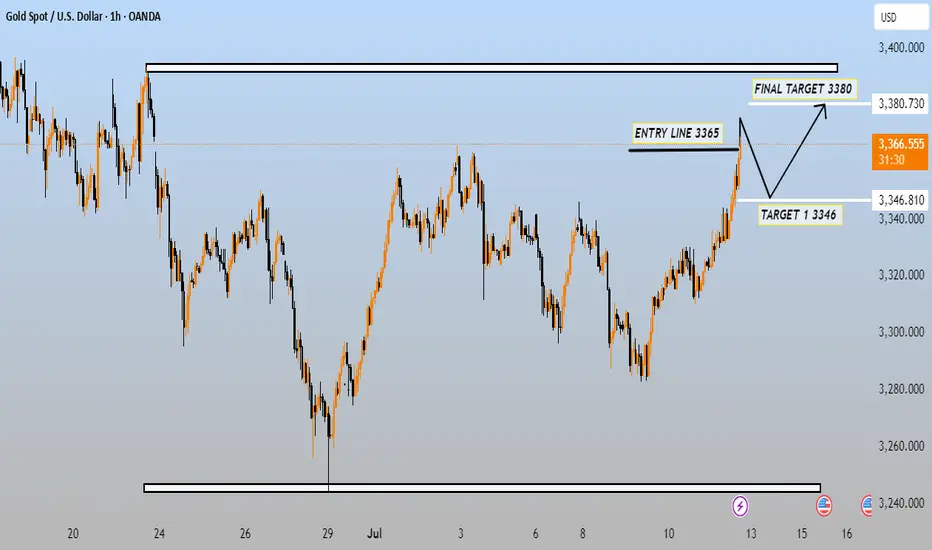
This chart is for Gold Spot against the U.S. Dollar (XAU/USD) on the 1-hour timeframe, and it outlines a potential bullish trading setup. Here's a breakdown of what it shows:
---
📈 Trading Plan Summary:
Entry Line: 3365 USD
Price is currently above this level at 3365.315 USD, so the entry has already been triggered.
Target 1 (First Pullback Target): 3346 USD
This is a potential pullback level after the initial move up. The chart anticipates price dipping back to this zone before continuing higher.
Final Target: 3380 USD
This is the bullish target, assuming the pullback completes and the uptrend resumes.
---
🔄 Expected Price Movement Path:
1. Price has moved up past the 3365 entry point.
2. A retracement/pullback is expected towards 3346 (first support).
3. From there, price is expected to bounce and continue upward to the final target at 3380.
---
🧠 Interpretation:
The chart suggests a long (buy) bias with a breakout above 3365.
The 3346 level is seen as a support zone where price might retest before continuing up.
3380 marks a potential resistance or take-profit area.
---
If you're trading this setup, consider:
Monitoring price behavior near 3346 for confirmation (e.g., bullish candles).
Using stop-losses below the support zone (around 3340 or lower).
Watching for momentum continuation above 3365 to hold toward 3380.
Let me know if you want help calculating risk/reward, lot sizing, or confirming technical indicators.
---
📈 Trading Plan Summary:
Entry Line: 3365 USD
Price is currently above this level at 3365.315 USD, so the entry has already been triggered.
Target 1 (First Pullback Target): 3346 USD
This is a potential pullback level after the initial move up. The chart anticipates price dipping back to this zone before continuing higher.
Final Target: 3380 USD
This is the bullish target, assuming the pullback completes and the uptrend resumes.
---
🔄 Expected Price Movement Path:
1. Price has moved up past the 3365 entry point.
2. A retracement/pullback is expected towards 3346 (first support).
3. From there, price is expected to bounce and continue upward to the final target at 3380.
---
🧠 Interpretation:
The chart suggests a long (buy) bias with a breakout above 3365.
The 3346 level is seen as a support zone where price might retest before continuing up.
3380 marks a potential resistance or take-profit area.
---
If you're trading this setup, consider:
Monitoring price behavior near 3346 for confirmation (e.g., bullish candles).
Using stop-losses below the support zone (around 3340 or lower).
Watching for momentum continuation above 3365 to hold toward 3380.
Let me know if you want help calculating risk/reward, lot sizing, or confirming technical indicators.
Join telegram free...
t.me/+16bIVCNBo0MzYzk0
Forex Gold & Crypto Signals with
detailed analysis & get consistent |
result ...
Gold Signals with peoper TP & SL for
high profit ...
t.me/+16bIVCNBo0MzYzk0
t.me/+16bIVCNBo0MzYzk0
Forex Gold & Crypto Signals with
detailed analysis & get consistent |
result ...
Gold Signals with peoper TP & SL for
high profit ...
t.me/+16bIVCNBo0MzYzk0
Disclaimer
The information and publications are not meant to be, and do not constitute, financial, investment, trading, or other types of advice or recommendations supplied or endorsed by TradingView. Read more in the Terms of Use.