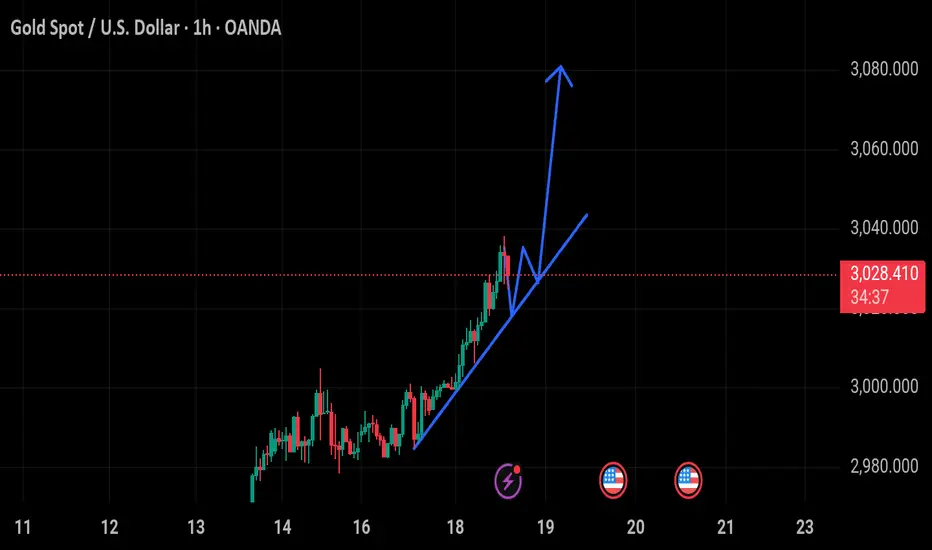
This is a 1-hour candlestick chart of Gold Spot (XAU/USD) against the U.S. Dollar, published on TradingView. The chart shows a clear uptrend, with price action forming higher highs and higher lows.
Key details:
The price is currently at $3,027.99, up $26.86 (+0.89%).
A trendline has been drawn to highlight the ascending pattern.
There is an annotated projection (blue lines) suggesting a potential breakout after a small pullback, leading to a further price increase.
Important economic events are marked on the lower part of the chart, possibly indicating upcoming U.S. financial data releases that could impact the market.
Overall, the analysis suggests a bullish outlook, expecting higher prices if the trend continues. Would you like a deeper technical breakdown?
Disclaimer
The information and publications are not meant to be, and do not constitute, financial, investment, trading, or other types of advice or recommendations supplied or endorsed by TradingView. Read more in the Terms of Use.
Disclaimer
The information and publications are not meant to be, and do not constitute, financial, investment, trading, or other types of advice or recommendations supplied or endorsed by TradingView. Read more in the Terms of Use.