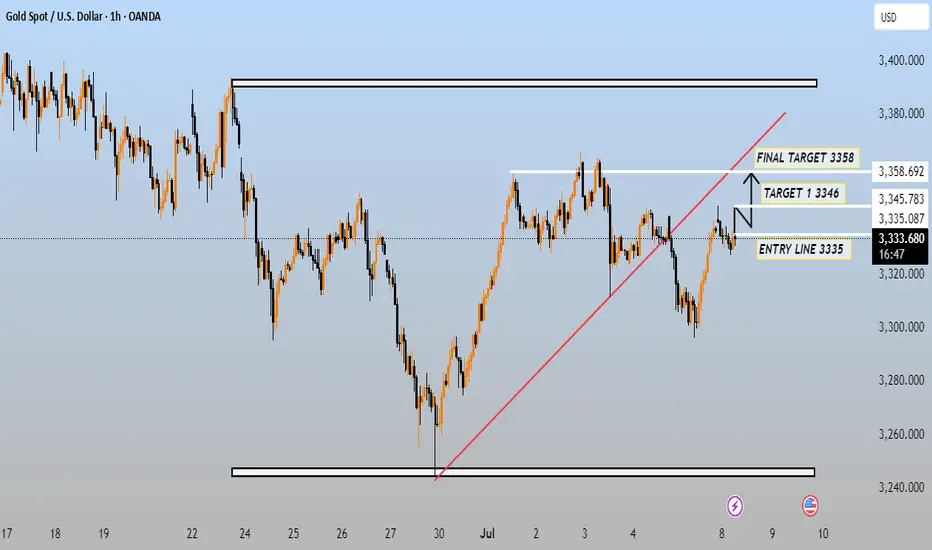
This chart is a technical analysis setup for Gold Spot (XAU/USD) on the 1-hour timeframe, indicating a potential long (buy) trade with specific entry and target levels:
Key Levels Highlighted:
Entry Line: 3335
Target 1: 3346
Final Target: 3358
Analysis Summary:
The price is currently at 3,334.490, just slightly above the entry level (3335).
A trendline (in pink) supports a recent upward move, although price briefly broke below it before recovering.
The targets are based on nearby resistance levels from past price action.
The final target (3358) aligns closely with a previous local high.
Implications:
If price sustains above 3335, the trade idea is to go long targeting 3346 first, then 3358.
A stop-loss is not explicitly shown but would logically be placed slightly below the 3335 entry or below the most recent swing low.
Notes:
Monitor how price reacts near the 3346 resistance – consolidation or rejection there might suggest taking partial profits.
A clean break above 3358 could lead to a move toward the previous major high near 3,380 (as seen on the left side of the chart).
Would you like help calculating a risk-reward ratio for this trade or setting a stop-loss?
Join telegram free...
t.me/+16bIVCNBo0MzYzk0
Forex Gold & Crypto Signals with
detailed analysis & get consistent |
result ...
Gold Signals with peoper TP & SL for
high profit ...
t.me/+16bIVCNBo0MzYzk0
t.me/+16bIVCNBo0MzYzk0
Forex Gold & Crypto Signals with
detailed analysis & get consistent |
result ...
Gold Signals with peoper TP & SL for
high profit ...
t.me/+16bIVCNBo0MzYzk0
Disclaimer
The information and publications are not meant to be, and do not constitute, financial, investment, trading, or other types of advice or recommendations supplied or endorsed by TradingView. Read more in the Terms of Use.