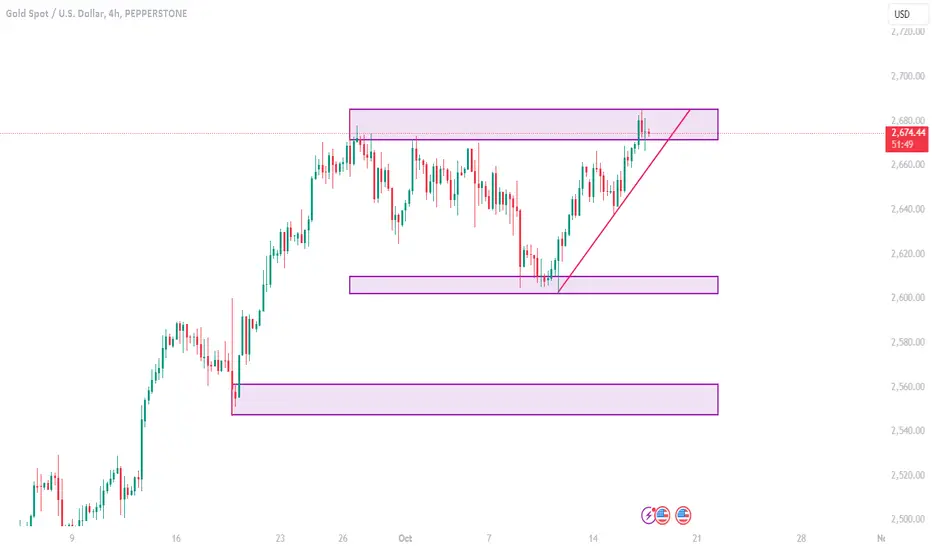
As you see on XAUUSD chart,the price has recently touched the 2,675 - 2,680 area, where it appears to be encountering resistance. This is confirmed by the multiple price rejections seen as small wicks at the top of recent candles.
Historically, the price had trouble breaking above this zone, indicating strong selling pressure.
Immediate support can be seen at around 2,660 - 2,665, based on previous pullbacks.
A more significant support zone is near 2,600, where price has previously bounced after a significant downward move.
The latest few candles show hesitation at the resistance zone, with smaller-bodied candles and upper wicks, indicating some selling pressure but no strong breakout yet.
The recent candles near the resistance zone do not show any strong bearish reversal patterns yet, such as an engulfing or pin bar, but the upper wicks and smaller body size indicate indecision.
The market is possibly waiting for a catalyst to either break out of this zone or retrace.
Doji-like candles (small-bodied candles with long wicks) suggest market indecision, and a break of these levels could indicate the next directional move.
If we apply Fibonacci retracement levels from the swing low near 2,520 (around early October) to the recent swing high near 2,680:
Key Fibonacci Levels:
23.6% retracement is at 2,640, which might act as the first minor support if the price retraces from this point.
38.2% retracement is at 2,610, a stronger level of support.
50% retracement is around 2,600, which aligns with the previously identified significant support zone.
61.8% retracement is around 2,580, which could act as a key reversal level if the price retraces that far down.
The overall trend is bullish.
The price has been making higher highs and higher lows since the beginning of October, suggesting continued bullish momentum.
Trend: The uptrend is clear, but momentum is slowing as the price approaches the resistance at 2,680.
Wicks: The upper wicks on recent candles show that sellers are stepping in around 2,675 - 2,680, preventing the price from moving higher easily.
Body Size: The shrinking size of the candles as they approach the resistance suggests that the buyers are losing strength, and sellers may be gaining control.
No Strong Breakout Yet: While the price is testing resistance, it hasn't made a decisive breakout, so caution is advised before entering a trade.
Short-Term Bullish Push: The last bullish rally started on October 14, which pushed the price from around 2,620 to the current level of 2,675.
If the price breaks below 2,660, we might see a retracement toward 2,640 (23.6% Fibonacci level) or lower to 2,600 (50% retracement level).
The current market appears to be in a consolidation phase around the resistance zone.
*****************************
Entry, Stop Loss (SL), and Take Profit (TP) Recommendations:
Sell at Resistance:
Entry: Consider selling near 2,675 - 2,680 if price action shows a strong rejection (e.g., bearish engulfing or shooting star).
TP1: 2,660 (short-term target).
TP2: 2,640 (23.6% Fibonacci level).
SL: Above 2,685 to avoid false breakouts.
Buy on Breakout:
Entry: If the price breaks and closes above 2,680, consider a buy.
TP: Aim for 2,700 as a psychological level or the next resistance zone.
SL: Below 2,670, just under the breakout level to minimize risk.
Buy at Support:
Entry: Consider a buy near the support at 2,640 (if the price retraces).
TP: 2,675 (retest of resistance).
SL: Below 2,630 to protect from further downside.
Sell on Break Below Support:
Entry: If price breaks below 2,660, consider selling toward the next support at 2,640 or 2,600.
TP: 2,640 for a short trade and 2,600 for a more extended move.
SL: Above 2,670 to avoid false breakdowns.
Briefly,the overall trend is bullish, but the price is struggling with resistance around 2,675 - 2,680.
Look for bearish candlestick patterns near this resistance for a potential sell opportunity.
If the price breaks out above this resistance, expect further upside.
Fibonacci retracement suggests support levels at 2,640, 2,610, and 2,600.
Consolidation is currently happening, so watch for a breakout or rejection of this zone before committing to a trade.
Proudly waiting for your ideas.
Best regards;
MD
Disclaimer
The information and publications are not meant to be, and do not constitute, financial, investment, trading, or other types of advice or recommendations supplied or endorsed by TradingView. Read more in the Terms of Use.
Disclaimer
The information and publications are not meant to be, and do not constitute, financial, investment, trading, or other types of advice or recommendations supplied or endorsed by TradingView. Read more in the Terms of Use.