Hi guys
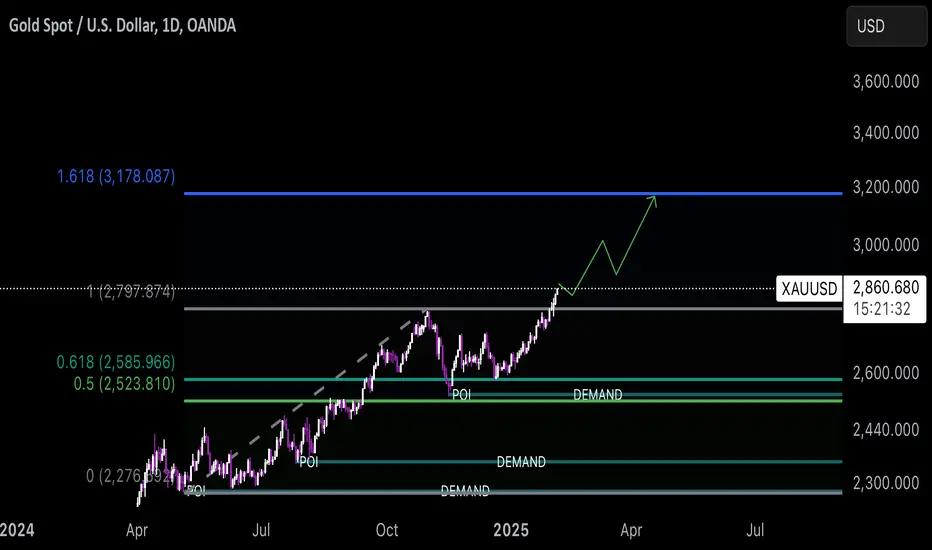
I took a look at your chart, which maps the daily price movements of Gold Spot against the U.S. Dollar (XAU/USD) from 2024 to 2025.
Here's a brief analysis:
### Price Trends:
- **Current Price**: $2,861.055, with a daily change of +18.765 (+0.66%).
- **Projected Movement**: The green arrow suggests a potential future price movement towards the $3,200.000 level.
### Key Levels:
- **Fibonacci Retracement Levels**:
- 0%: $2,276.094
- 50%: $2,523.810
- 61.8%: $2,585.966
- 100%: $2,797.874
- 161.8%: $3,178.087
### Points of Interest:
- **POI and Demand Zones**: Highlighted to indicate potential areas where the price could react (either by rebounding or consolidating).
### Trading Information:
- **Sell Price**: $2,860.660
- **Buy Price**: $2,861.370
### Insight:
The chart indicates a bullish trend with the projection towards the higher price level of $3,200. The Fibonacci levels provide potential support and resistance areas, useful for identifying trade opportunities.
If you're into gold trading or investing, this chart is valuable for tracking price movements and making informed decisions. Let me know if you need further assistance or specific insights! 😊
Disclaimer
The information and publications are not meant to be, and do not constitute, financial, investment, trading, or other types of advice or recommendations supplied or endorsed by TradingView. Read more in the Terms of Use.
Disclaimer
The information and publications are not meant to be, and do not constitute, financial, investment, trading, or other types of advice or recommendations supplied or endorsed by TradingView. Read more in the Terms of Use.