Market news:
In the early Asian session on Thursday (April 17), spot gold rose slightly, once hitting a record high of around $3,357 per ounce. As the trade situation became increasingly tense, investors turned to safe-haven assets. The chairman of the Federal Reserve admitted that economic growth was slowing down, and the U.S. stock market, the U.S. dollar and U.S. bond yields fell sharply, which also provided momentum for the rise of gold prices. International gold prices soared dramatically, and the London gold price broke through the $3,300 per ounce mark and set a new high. Gold still has strong support, including a weaker U.S. dollar, uncertainty about tariff news, and concerns about a global recession. The escalating tensions between the world's two largest economies have hit confidence in financial markets, and investors have begun to flock to assets such as gold for risk aversion. At the same time, the U.S. dollar fell against other major currencies and remained at a nearly three-year low hit last week, meaning that gold has become relatively cheap for buyers holding foreign currencies. This trading day will usher in the European Central Bank's interest rate decision, and the market generally expects a 25 basis point drop; in addition, the changes in the number of initial jobless claims in the United States, the initial value of the annualized total number of building permits in the United States in March, and the annualized total number of new housing starts in the United States in March will also be released, and investors need to pay attention to them. Friday is the Good Friday holiday, and investors also need to be wary of brokers' position adjustments before the holiday.
Technical Review:
Trends are king. Whether you believe it or not, do it or not, gold continues to set new historical highs, soaring, and soaring. The price continues to run in the trend structure, the buying trend structure is intact, and the daily line continues to close strongly! However, it is necessary to pay attention to the daily price reaching the upper track of the Bollinger band, the four-hour chart is 9 consecutive positive, and the RSI indicator is overbought above the 80 value. It is necessary to pay attention to the emergence of a high-rise and fall-back wash trend. Buy at a low price and wait for a callback to the relative low point layout. At present, gold has basically rushed to the sky. In April, you can basically see the fluctuation range of gold within 70-100 points every day. In this market, you say that fixed points are sometimes fleeting, and the optimistic resistance is like paper that can be broken at the touch of a button. So is gold really going to the sky? I can only say that under such favorable conditions, it is really difficult to see gold fall! From a macro level, the daily chart gold price has formed a lasting upward trend since the low of $2536.68. The current price is around $3350, which is significantly higher than all major moving averages, indicating that the long-term bullish momentum is still strong. The golden cross pattern of the MACD indicator on the daily chart continues to develop, indicating that the long-term trend momentum is still upward. This year, the trend cannot be changed. There is a callback squat or sideways consolidation, which are all bullish opportunities; So once the big positive K is closed today, the retracement above the top and bottom support of 3315 will continue to be bullish. As for the height, the third derivative wave of the monthly line is calculated at 3444 by 2 times, which is also the goal of the next stage.
Today's analysis:
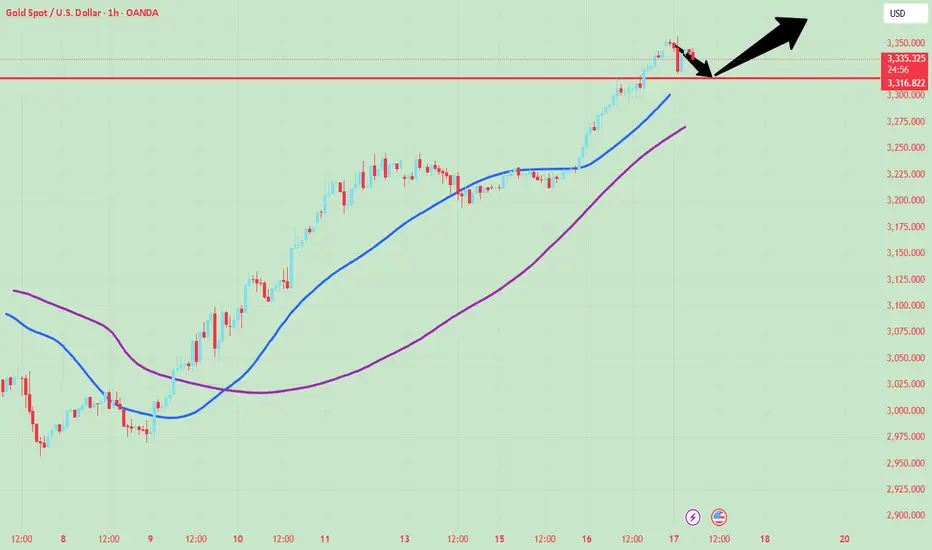
Gold has been crazy recently, and the buying momentum of gold has been galloping all the way. In the past two days, I woke up every day and opened my eyes. Gold has reached a new high again. The buying power of gold is very strong. It was bought at 3342 in the Asian session and harvested at 3355. Although gold is crazy now, we should also pay attention to the purchase of gold at any time. The current trend of gold buying has not changed. Continue to buy when it falls in the Asian session. The 1-hour moving average of gold continues to be a golden cross and the upward buying divergence arrangement. It is difficult for gold to have a big correction if it is strong. After gold began to fall and fluctuate and adjust at the line near 3315 yesterday, gold continued to break upward in the US session. Then the short-term 3315 of gold will form support again. Gold will continue to buy on dips when it falls back to 3315. If gold falls back to around 3320, it can continue to buy. Before there is no particularly obvious sign of a sharp decline, buying has become our only choice, and it is also the best and safest choice! While being bullish, pay attention to the opportunity to fall back. Unless the strength is suddenly strong at that time, don't buy easily. Wait patiently for the opportunity to fall back. How long can gold buying be crazy? No one knows that there is no top when it rises. Since gold is so crazy, what we have to do is follow it. It is difficult for gold to fall sharply before a large-scale sell signal appears!
Operation ideas:
Short-term gold 3317-3320 buy, stop loss 3308, target 3360-3380;
Short-term gold 3387-3390 sell, stop loss 3398, target 3340-3330;
Key points:
First support level: 3340, second support level: 3332, third support level: 3315
First resistance level: 3363, second resistance level: 3377, third resistance level: 3386
In the early Asian session on Thursday (April 17), spot gold rose slightly, once hitting a record high of around $3,357 per ounce. As the trade situation became increasingly tense, investors turned to safe-haven assets. The chairman of the Federal Reserve admitted that economic growth was slowing down, and the U.S. stock market, the U.S. dollar and U.S. bond yields fell sharply, which also provided momentum for the rise of gold prices. International gold prices soared dramatically, and the London gold price broke through the $3,300 per ounce mark and set a new high. Gold still has strong support, including a weaker U.S. dollar, uncertainty about tariff news, and concerns about a global recession. The escalating tensions between the world's two largest economies have hit confidence in financial markets, and investors have begun to flock to assets such as gold for risk aversion. At the same time, the U.S. dollar fell against other major currencies and remained at a nearly three-year low hit last week, meaning that gold has become relatively cheap for buyers holding foreign currencies. This trading day will usher in the European Central Bank's interest rate decision, and the market generally expects a 25 basis point drop; in addition, the changes in the number of initial jobless claims in the United States, the initial value of the annualized total number of building permits in the United States in March, and the annualized total number of new housing starts in the United States in March will also be released, and investors need to pay attention to them. Friday is the Good Friday holiday, and investors also need to be wary of brokers' position adjustments before the holiday.
Technical Review:
Trends are king. Whether you believe it or not, do it or not, gold continues to set new historical highs, soaring, and soaring. The price continues to run in the trend structure, the buying trend structure is intact, and the daily line continues to close strongly! However, it is necessary to pay attention to the daily price reaching the upper track of the Bollinger band, the four-hour chart is 9 consecutive positive, and the RSI indicator is overbought above the 80 value. It is necessary to pay attention to the emergence of a high-rise and fall-back wash trend. Buy at a low price and wait for a callback to the relative low point layout. At present, gold has basically rushed to the sky. In April, you can basically see the fluctuation range of gold within 70-100 points every day. In this market, you say that fixed points are sometimes fleeting, and the optimistic resistance is like paper that can be broken at the touch of a button. So is gold really going to the sky? I can only say that under such favorable conditions, it is really difficult to see gold fall! From a macro level, the daily chart gold price has formed a lasting upward trend since the low of $2536.68. The current price is around $3350, which is significantly higher than all major moving averages, indicating that the long-term bullish momentum is still strong. The golden cross pattern of the MACD indicator on the daily chart continues to develop, indicating that the long-term trend momentum is still upward. This year, the trend cannot be changed. There is a callback squat or sideways consolidation, which are all bullish opportunities; So once the big positive K is closed today, the retracement above the top and bottom support of 3315 will continue to be bullish. As for the height, the third derivative wave of the monthly line is calculated at 3444 by 2 times, which is also the goal of the next stage.
Today's analysis:
Gold has been crazy recently, and the buying momentum of gold has been galloping all the way. In the past two days, I woke up every day and opened my eyes. Gold has reached a new high again. The buying power of gold is very strong. It was bought at 3342 in the Asian session and harvested at 3355. Although gold is crazy now, we should also pay attention to the purchase of gold at any time. The current trend of gold buying has not changed. Continue to buy when it falls in the Asian session. The 1-hour moving average of gold continues to be a golden cross and the upward buying divergence arrangement. It is difficult for gold to have a big correction if it is strong. After gold began to fall and fluctuate and adjust at the line near 3315 yesterday, gold continued to break upward in the US session. Then the short-term 3315 of gold will form support again. Gold will continue to buy on dips when it falls back to 3315. If gold falls back to around 3320, it can continue to buy. Before there is no particularly obvious sign of a sharp decline, buying has become our only choice, and it is also the best and safest choice! While being bullish, pay attention to the opportunity to fall back. Unless the strength is suddenly strong at that time, don't buy easily. Wait patiently for the opportunity to fall back. How long can gold buying be crazy? No one knows that there is no top when it rises. Since gold is so crazy, what we have to do is follow it. It is difficult for gold to fall sharply before a large-scale sell signal appears!
Operation ideas:
Short-term gold 3317-3320 buy, stop loss 3308, target 3360-3380;
Short-term gold 3387-3390 sell, stop loss 3398, target 3340-3330;
Key points:
First support level: 3340, second support level: 3332, third support level: 3315
First resistance level: 3363, second resistance level: 3377, third resistance level: 3386
Disclaimer
The information and publications are not meant to be, and do not constitute, financial, investment, trading, or other types of advice or recommendations supplied or endorsed by TradingView. Read more in the Terms of Use.
Disclaimer
The information and publications are not meant to be, and do not constitute, financial, investment, trading, or other types of advice or recommendations supplied or endorsed by TradingView. Read more in the Terms of Use.