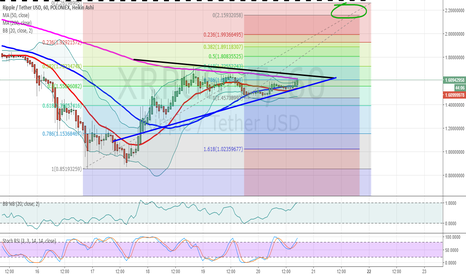
I am using the 8 hour chart to watch XRPUSDT as the 200 MA here is providing the base support. It is an interesting chart and as you can see it looks as though XRPUSDT is breaking out (red circle).
I have extended the 20 MA and 50 MA to show what would need to happen to move it to a new all time high. I would want to see the 20 MA move up through the 50 and this would be a strong indicator that traders would be looking for and would propel it to new highs. I have set an early target here in the 4.80 to 5.00 range and I feel that is a modest target as if we do get the bullish cross I have described it would over shoot my mark into the 5.20 range fairly easily if not higher.
I had expected some sort of retrace to make a second shadow bottom and this may still happen but it does have good support on the 200 MA on the 15 minute and 30 minute charts already so potentially we will see more of a sideways and up move from here.
Indicators are also looking good here although again it would seem as though we would expect the very small wave to the down and sideways on the MacD.
Note
Here on the one hour chart I have placed my trend lines on the 200 MA (black) and 50 MA (blue) and we can see that it has not quite achieved a break out condition but is very close. We would want to see the 50 MA move up through the 200 to get a decent rally. One concern though is the steepness of the 200 still moving to the downside and this average will have to be turned around. This tells me that it is likely that in the short term there will be some continued sideways momentum and potentially a small move to the downside but nothing too severe. Under this scenario even if the 50 moves up through the 200 it will not have much momentum to continue the rally.
So more sideways action is predicted and patience is the key here.

Disclaimer
The information and publications are not meant to be, and do not constitute, financial, investment, trading, or other types of advice or recommendations supplied or endorsed by TradingView. Read more in the Terms of Use.
Disclaimer
The information and publications are not meant to be, and do not constitute, financial, investment, trading, or other types of advice or recommendations supplied or endorsed by TradingView. Read more in the Terms of Use.
