XTIUSD (WTI Crude Oil)
Timeframe: 4H
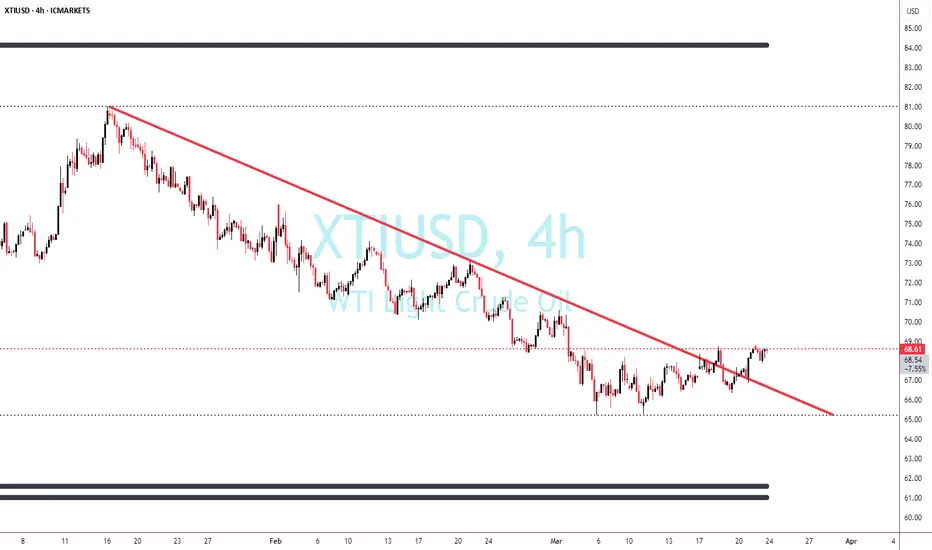
1. Mak Method
Price recently broke above the descending trendline, indicating a potential bullish shift.
Key 369 Level: Price is hovering around $68.61, aligning with my levels.
If price maintains above $67.50, we could see continued bullish movement.
2. Fibonacci, Gann Levels & Elliott Wave
Fibonacci Retracement:
61.8% level at $72.50, making it a critical upside target.
Gann Levels:
Major support at $66.00, which aligns with institutional buying zones.
Elliott Wave Count:
Potential Wave 3 underway, with a break above $70 confirming bullish momentum.
3. Key Technical Levels (Support & Resistance)
Support Levels:
$67.50 - $66.00 → Strong demand zone, potential bullish retest.
$61.50 - $60.00 → Major institutional support (if breakdown occurs).
Resistance Levels:
$69.50 - $70.00 → Short-term resistance, possible liquidity grab.
$72.50 - $75.00 → Next bullish target, aligning with Fibonacci & order blocks.
4. Probable Scenarios with Probability %
Scenario Probability
Bullish Breakout: Retest of $67.50, then continuation to $70-$72.50. 65%
Fake Breakout & Rejection: Price rejects $69.50 and retraces to $66.00. 25%
Bearish Breakdown: Failure to hold $66.00, leading to a drop to $61.50-$60.00. 10%
5. Conclusion & Trading Strategy
Bias: Bullish above $67.50, bearish below $66.00.
Entry Areas:
Long Entry → Retest of $67.50 with confirmation.
Short Entry → Breakdown below $66.00, targeting $61.50.
Stop Loss:
Long trades → Below $65.80.
Short trades → Above $70.50.
Final Thoughts:
Watch for false breakouts at $69.50 before confirming bullish moves.
If price consolidates above $68.50 - $69.00, we could see a rally toward $72.50 - $75.00.
Volume Confirmation: Institutional buying at $67.50 could trigger a strong bullish move.
Timeframe: 4H
1. Mak Method
Price recently broke above the descending trendline, indicating a potential bullish shift.
Key 369 Level: Price is hovering around $68.61, aligning with my levels.
If price maintains above $67.50, we could see continued bullish movement.
2. Fibonacci, Gann Levels & Elliott Wave
Fibonacci Retracement:
61.8% level at $72.50, making it a critical upside target.
Gann Levels:
Major support at $66.00, which aligns with institutional buying zones.
Elliott Wave Count:
Potential Wave 3 underway, with a break above $70 confirming bullish momentum.
3. Key Technical Levels (Support & Resistance)
Support Levels:
$67.50 - $66.00 → Strong demand zone, potential bullish retest.
$61.50 - $60.00 → Major institutional support (if breakdown occurs).
Resistance Levels:
$69.50 - $70.00 → Short-term resistance, possible liquidity grab.
$72.50 - $75.00 → Next bullish target, aligning with Fibonacci & order blocks.
4. Probable Scenarios with Probability %
Scenario Probability
Bullish Breakout: Retest of $67.50, then continuation to $70-$72.50. 65%
Fake Breakout & Rejection: Price rejects $69.50 and retraces to $66.00. 25%
Bearish Breakdown: Failure to hold $66.00, leading to a drop to $61.50-$60.00. 10%
5. Conclusion & Trading Strategy
Bias: Bullish above $67.50, bearish below $66.00.
Entry Areas:
Long Entry → Retest of $67.50 with confirmation.
Short Entry → Breakdown below $66.00, targeting $61.50.
Stop Loss:
Long trades → Below $65.80.
Short trades → Above $70.50.
Final Thoughts:
Watch for false breakouts at $69.50 before confirming bullish moves.
If price consolidates above $68.50 - $69.00, we could see a rally toward $72.50 - $75.00.
Volume Confirmation: Institutional buying at $67.50 could trigger a strong bullish move.
Trade closed: target reached
Disclaimer
The information and publications are not meant to be, and do not constitute, financial, investment, trading, or other types of advice or recommendations supplied or endorsed by TradingView. Read more in the Terms of Use.
Disclaimer
The information and publications are not meant to be, and do not constitute, financial, investment, trading, or other types of advice or recommendations supplied or endorsed by TradingView. Read more in the Terms of Use.