BTC: Lost Key Support! What’s Next?🚀 Hey Traders!
If you’re finding value in this analysis, smash that 👍 and hit Follow for high-accuracy trade setups that actually deliver! 💹🔥
🚨 BTC Breakdown Alert!
BTC has lost the critical GETTEX:87K -$90K support in the daily timeframe—a level it held strong for over 3 months! Now, it's looking like a bearish retest, which could lead to another leg down. 📉
🔻 Next Major Support: $72K-$75K
✅ Bullish Reclaim? BTC must close above GETTEX:87K on the daily to confirm this as a fakeout—until then, the bias remains bearish.
🔥 What’s your take? Are we heading lower, or will BTC reclaim its lost ground? Drop your thoughts below! ⬇️🔥
1-BTC

Bitcoin on strong supportIf we check the daily 200MA (red momentum ) and we calculate the double top target, they give us 80 - 82k for bitcoin as the strong support. but we still need to close weekly candle above 92k

Bitcoin Recovers Much Faster Than ExpectedThree days waiting is not a long time.
Here we are again today and Bitcoin is already recovering. It seems and feel like the end of the world but, truly, nothing really happened.
Last week Bitcoin closed at $96,000. This week Bitcoin starts by moving lower and yes, it feels like it is the end of the world but this is only noise based on the short-term. Bitcoin is already recovering and by the time the week closes we will be back above $90,000 and very likely aiming higher and higher; Bitcoin will move higher and grow long-term.
Let's go back to what I was saying just a few months ago.
1) Bitcoin is super-bullish when it closes weekly above $90,000.
2) Bitcoin remains long-term bullish and really strong if it closes monthly above $80,000.
So far, there hasn't been one single close below 90K. This week is not yet over, the week is only halfway through and you'll see... We will see how it all ends but the most likely scenario is that Bitcoin will be moving back up.
Another thing that was said is that Bitcoin will be bullish in March 2025. Not only Bitcoin but the entire Cryptocurrency market. Marketwide bullish action and the Altcoins will grow.
This is it. It is happening, it is all real.
We are looking at a major and final flush. This happens all the time before a massive bullish wave. Just before the market turns, we tend to see a crash, a sudden crash. As people prepare for lower, lower and forever red; the start of a bear-market, no, a bearish impulse; this is actually the end.
There is no long-term bearish action and there is no more lows. Bitcoin is recovering now and we are bullish in a matter of days. Once the market turns green, we will see and experience long-term growth.
This is certain just as certain as tomorrow morning we will see the sun. That's how strong Bitcoin is. There is no way to put Bitcoin down. Bitcoin only goes down to recover and become stronger than ever before. We are only looking for strength, removing weak hands. Are you sure you want to be part of this incoming bullish phase? If yes, then you have to be able to hold when things get though, this is the test.
The test is over and it only lasted a few days.
Hold strong, because Bitcoin is going up.
You will be happy with the market, with Bitcoin, with the Altcoins and with how fast your profits accumulate and your capital grows. That is, if you are buying now and feel ready to hold.
Namaste.

Bitcoin Upward WavesSince the previous Bitcoin Impulse wave analysis got very long, here the subsequent analyses for Bitcoin Upward waves will be presented. Anyway, continuing from the last analysis; the correction started when Bitcoin touched the major channel's upper line and the horizontal resistance area (The chart of previous analysis is provided for reference in blow). There are two possible areas for the current Bitcoin't correction wave. The first is the purple triangle, and the second is the orange one. The only difference between these two areas is that if the Bitcoin reaches the orange triangle, the major ascending channel will be invalidated, since Bitcoin has breached the channel's bottom. Let's see what happens.

75k is INEVITABLE.I published my idea on BINANCE:BTCUSDT how it is forming Double Top pattern and indicators are making divergences in late January. Since BTC hit our first take profit point we might expect little bit of pullbacks and see if it is gonna react to 91k area, but Volume is not looking good that means we might see red candles all the way to 75k area. 75k area was major resistance zone which would work as support this time.

BTC - PUNCH to 95k or 78k?Well 80k looks good but now if it dances through, it goes like ballerina to fall and direct fall is the purple ones!

Bitcoin trending down amid Trump's policy uncertainty
Investors withdrew over 30.7k BTC, lowering the bitcoin Balance on Exchanges to about 2.725 mln BTC, indicating lower market liquidity. ETF investors continue redeeming for the seventh consecutive day, with a two-day outflow totaling over 1300 mln USD. Reduced liquidity could trigger a sudden price rebound if selling pressure on ETF eases.
BTCUSD broke below 86500 and formed a lower low. The price is below both EMAs, indicating the persistent bearish momentum. If BTCUSD breaks above 86500, the price may retest the following resistance at 91100. Conversely, a retracement before resuming its downtrend to the support at 73200 may prompt a return to the resistance at 86500.

BTC Price Target #2: A Bounce Off the 200 MA or Golden PocketA case more bullish than an undoing of the move of BTC from $60K to six digits...
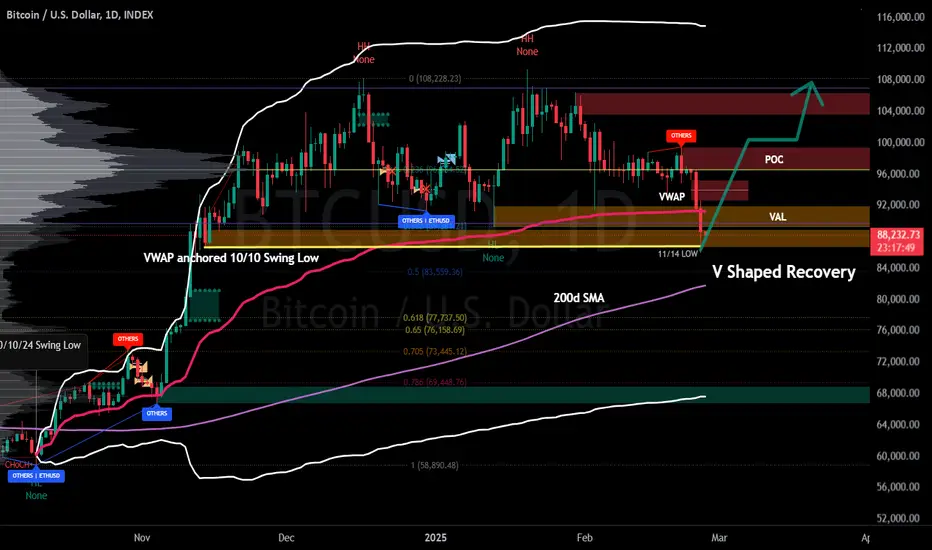
Price action could plausibly retrace to the 200d MA or Golden Pocket of the move from the 10/10/24 Swing Low and find support on either.
This case would likely play out as a violent wick down and v-shaped return to VAL of the volume profile. If we are talking a Golden Pocket retracement, a noteworthy CME Gap would be filled.

Next leg up? Gap just filledThere were a huge liquidity gap around 80k that just got filled. market is ready for another bull run.

$BTC - Bottom In, Time To BuyHello Friends,
For those of you looking to capitalize on Bitcoin BITSTAMP:BTCUSD you may want to add to your position, or start accumulating for the first time.
I posted 2 days ago saying to wait for $85,000 USD on CRYPTOCAP:BTC
As well back in December 4, 2024 I posted my ideal entry would be $85,000.
We now have our confirmation to Buy/Long

LTC - Short play I have entered short on LTC as it is now overbought, while in a major downtrend and has reached an hourly resistance.

Is the Bull Run Over? BTC to $70K? (#7)Bitcoin has experienced significant volatility in recent days, dropping to the first major support level at $85K. Let’s analyze the key fundamental drivers behind this decline, upcoming triggers, and finally, share a few words for those who faced liquidation or major losses.
Fundamental Factors Behind Bitcoin’s Decline
In recent days, Bitcoin has suffered a sharp correction, declining approximately 7.1% over the past week, falling from $99,244 to $86,776 . This February 25, 2025, market downturn—dubbed a “market bloodbath”—was driven by a combination of macroeconomic, geopolitical, and crypto-specific factors. Here’s a breakdown:
1. Capital Outflows from Bitcoin ETFs 📉
One of the primary reasons for Bitcoin’s recent decline has been significant capital outflows from Bitcoin ETFs. Reports indicate that over $1 billion exited these funds in the past two weeks, with the worst single-day outflow reaching $583 million . This reduced demand exerted downward pressure on Bitcoin’s price.
2. Strengthening US Dollar (DXY Index) 💵
The DXY index , a measure of the US dollar’s strength, has surged to 106.4385 , its highest level in recent years. Historically, a stronger dollar diminishes the appeal of risk-on assets like Bitcoin. This inverse correlation was a key factor in Bitcoin’s recent selloff.
3. Geopolitical Tensions & Economic Uncertainty 🌎
Recent decisions by Donald Trump’s administration , such as imposing trade tariffs on Canada and Mexico and investment restrictions on China, have fueled market uncertainty. As a result, investors are flocking to safe-haven assets, which has further pressured Bitcoin.
4. Broader Market Volatility & Crypto-Specific Events
Stock Market Turbulence: The S&P 500 recorded its worst week since Trump’s inauguration, and the Nasdaq is down 5% from its December 2024 highs. This increased risk aversion has negatively impacted Bitcoin.
Bybit Hack & Trust Issues: The recent Bybit hack , where $1.5 billion was stolen, has shaken confidence in centralized exchanges, prompting mass withdrawals.
Mass Liquidations: Over the past 24 hours, more than $650 million in leveraged positions were liquidated, amplifying the price drop.
Technical Analysis: Where is Bitcoin Headed?
1. Daily Time Frame Analysis 🕵️♂️
Bitcoin is now testing a key support zone at $85K. The next critical support lies at $80K–82K, which aligns with major demand zones and historical price action.
Bullish Case: If Bitcoin holds above $85K, it could resume the major uptrend and reclaim higher levels.
Bearish Case: A break and close below $80K–82K would invalidate the bull run, shifting the major trend to bearish and signaling a deeper correction.
2. Bitcoin Dominance (BTC.D) & Altcoin Market 📊
BTC.D remains elevated, meaning capital is concentrated in Bitcoin rather than altcoins. However, if BTC consolidates while BTC.D drops, it could trigger an altcoin season. In contrast, if Bitcoin breaks below $85K, short setups on altcoins become highly attractive.
3. Trading Strategy & Next Steps
For Bulls 🐂: Look for bullish confirmations above $85K with proper risk management.
For Bears 🐻: Wait for a confirmed breakdown below $80K–82K before entering short positions.
Altcoin Traders 💎: If BTC finds support, focus on potential altcoin bounces; if BTC breaks down, short weak altcoins.
Final Thoughts: A Message for Those Facing Losses
Many traders faced liquidations or heavy losses during this drop. If you’re among them, take a deep breath— this is part of the trading journey. Every successful trader has gone through periods of adversity. Learn from your mistakes, refine your risk management , and move forward smarter.
This is not the end—it’s just another phase of the market cycle. Stay patient, stay disciplined, and keep growing.
I’m Skeptic , and I’ll see you in the next analysis! 🔥

$BTC Beraish ?!Bitcoin has formed a double top and is pulling back.
The marked zone has broken out strongly, increasing the chances of an upward move. However, I expect it to range heavily rather than move sharply.
I’ve analyzed different scenarios.

BTC FEAR AND GREED INDEXAfter BTC corrects to the $86K level and the Timeline sentiment hit an all time low it got me thinking, is there any correlation between sentiment around pivotal price levels of the market? To find out I studied the "Fear and Greed Index", an indicator that uses a range of sources such as volatility, volume, sentiment, dominance and trends to give a score out of 100. 1 being peak fear and 100 being peak greed.
The results were interesting, currently the FGI is 21/100 (extreme fear) and if you've spent much time on crypto twitter is does feel that way too. However, during this bull market there are two key price areas where BTC had the same score:
Bear market bottom -
When the bear market ended after a full year of brutal selling BTCs price was around $16K with the same FGI score as today with 21. This signaled the end to the selling and began the bull market we have now.
Q2-23 '24 bottom -
For me, the most relevant time to compare FGI with todays score is with the bottom of the bearish trend channel we suffered through in 2024. Although price did wick below this $53,923 level to hit GETTEX:49K , the daily didn't close below it and so the September 6th low is the trend channel bottom. FGI score of 22 provided the springboard for the next leg up.
So with his information the real question is this: Are we still in a bull market? If the answer is yes, then history tells us once FGI reaches these levels the bottom is in and the next leg up is around the corner.
If the answer is no then the printing of a new lower high after yesterdays lower low will be confirmation of bitcoin rolling over.
I am not sure which is true but having a plan for both will be very important.

(BTC) bitcoin "head & shoulders, head & shoulders"BTC is not going to fall all the way down. The price is decreasing in price, yes.. Sentiment is not good right now from many points of view. There is more to come from BTC and there is always a strong urge to buy BTC by seekers who are only growing their wallet size holdings of BTC. 'What's in your wallet," the motto made famously by MasterCard, is befitting of BTC even if there are fewer people now that use BTC to make real transactions. The worst of cryptocurrency development over the last two years is in seeing almost no new companies offering a way to pay with BTC. Pay with BTC. Pay with Doge. Pay with XLM. Don't pay with credit cards that leak your identity and lose precious personal information in data breach hacks. The only way to reduce the dark market interests of criminals who sell hacked personal identity information is to use components of finance that resist hackers attempts to steal information from consumers. There is hardly anything that can be purchased using BTC, DOGE, XLM, et al. etc. in the real world.

The descending channel on btc is wider than originally thought Now that we have had a bounce from yesterday’s big red candle I was able to find two new parallell trendlines that essentially widened the descending channel price has been consolidating in. We need price to get back above the red line soon however for that is a double top neckline, a double top with a full breakdown target of 70k, so we definitely wanna avoid triggering that breakdown by getting price action back above the red line ASAP. *not financial advice*

$SPY $SPX Pullback to Gap Fill? I've been waiting for a rocket to AMEX:SPY $630 but my monthly tells me that February wants to close red. Here is my daily with a fib that we cant seem to hold above although today we did close above once I have been waiting patiently in this box unlike others, I have constantly reiterated, don't try to be a hero inside of the box. Now that the Box seems to be pushing towards the upside, I can't help but notice we continue printing bearish candles regardless of direction. Today we closed with a Hangman, which begs the question, could we perhaps lean bearish for two of the most bearish weeks of the year in comparison? I'd like to think I'm not wrong here and we will get a spill before anyone gets an expected blow off top. Be careful out there, volatility remains present and the VIX was above the 50DMA last time I checked. If we can get this gap fill and start moving back up, I will be confident in the gap fill being bottom. Seeing as $593 AMEX:SPY alert for bottom never filled, I will have to assume it's still a possibility. Taz out.

BTS Heading to 74K or Is It Just a Shakeout?Not a pretty picture, is it? I hope it's just a shakeout of weak hands and not truly a breakdown.
The price has clearly closed below significant lows. Only saving grace is that the yesterday low is around 38.2% retracement of the rise from lows of August 2024 (sub 50K level).
Let's hope it reverses for good from here. If not, it's not just #BTC that will fall but majority of cryptos with it.

BTC Price Target #3: The Bullish Case, V-Shaped RecoveryImplausible without a positive catalyst and a return of interest in 'Risk On':
A V Shaped recovery of price action, reclaiming the value area in question, support of the VWAP and POC, essentially reversing the dump begun 2/21 with the curiously timed revelation of the Bybit hack...
Should price action *rapidly* reclaim GETTEX:97K --or, better yet, $99.8K--and confirm the recovery with a Daily close above, the supposed post-halving bull run would be on again. For now...
Such an outcome would be consistent with an (arguable) Double Bottom--if not #JTTW.
BTC Price Target #1: Most Bearish CaseMy most bearish guess for where BTC price proceeds from here (2/25/25):
Consistent with a Double Top, we see basically a 786 retracement (however circuitous) below the 200d SMA to levels preceding the move to $100K begun in November of 2024.
This could--and would likely--involve a bearish retest of the VAL of the volume profile anchored at the 10/10/24 Swing Low, a dead-cat bounce and retest of its POC, and/or a bear-flagging decent to the level in question.
It's plausible, especially given the lack of volume in crypto markets since December of 2024, however much the history of post-halving years would suggest otherwise. Also favoring the bearish case: the persistence of QT and the unlikelihood of significant cuts in the Federal Funding Rate.

!!! BITCOIN !!! - Bitcoin Target !Hi,
The first recovery zone is at the MA200 line (1D)
It seems like a great opportunity to buy.
This is just an idea.
Be careful!

BTC BREAKOUTA preliminary look at the ongoing--perhaps engineered--collapse since the Bybit cold wallet fiasco...
The retracement to the $90K range, expected by many, from the ATH of 1/20 finally seems to have broken price action out of the prolonged compression in which has been stuck for over a month now. Where it's far from over, a couple of things stand out.
Presuming price action doesn't continue past the wick to just under GETTEX:87K in the next two days (time of writing: 14:00 UTC on 2/25), we could be looking at an interesting Double Bottom formed with the low of 11/14/24.
Given the loss of GETTEX:92K , we can fairly conclude that BTC has fallen back into a greater volume profile, one I have anchored here at 10/10/24, a prominent Swing Low. Bullish case : price action moves back quickly over the VAL and regains support over the value area POC and VWAP.
Bearish case : Price action is rejected at the VAL and continues to the next level of support. (High 70's? A retracement to $77K would fill the noteworthy CME Gap in that area.)
What ultimately makes or breaks the case for a 2025 Bull Run for BTC and crypto is a resumption of the interest in space that has characterized previous Post-Halving Years. That has been lacking so far in 2025.

$BTC Current Decline Analysis - 2/25/2025Update... 2/25/2025
As projected, Wave (e) has technically been completed.
Does this mean the correction is over? The answer is no, for the following reasons:
If the rebound holds, we can say the current 5-wave decline structure is complete. However, there's a possibility that the structure could evolve into a 7-wave formation. In this case, we need to watch for Wave (f), which could conclude at the $93,200 level (f = 61.8% a) or the $96,67x level (f=a).
Let's see how it plays out!
Cheers!
CRYPTOCAP:BTC #BTCUSD #Bitcoin #BTC
