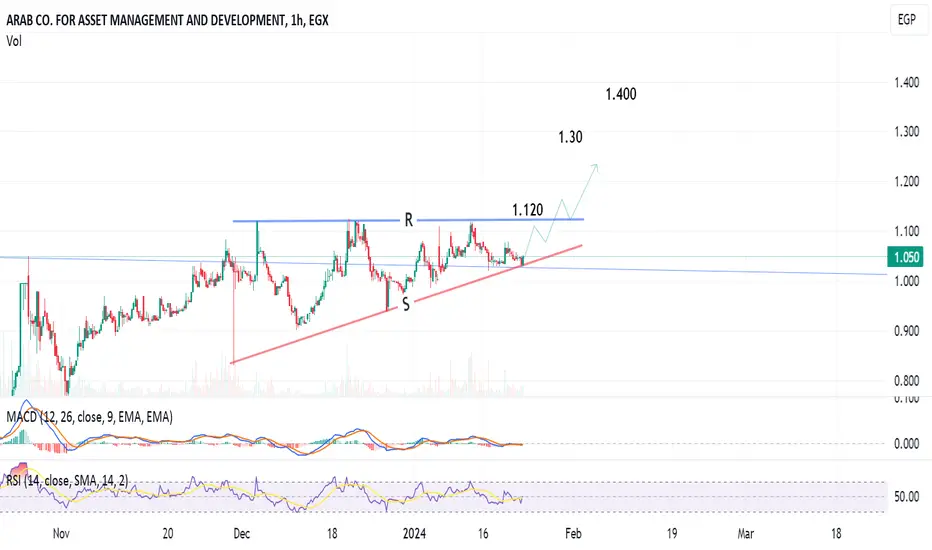
ACAMD to target 1.12 then 1.40 after crossing Resistance1-hour chart, the stock is trading in a rising triangle pattern, going to hit the Resistance line (blue) at around 1.118 - 1.120.
After crossing up, the target will be 1.30 then 1.40
Stop loss below the support line.
ACAMD
ACAMD has a potential to reach 1.82 after crossing 1.38Weekly chart, the stock is trading near a resistance zone, and is trying to cross 1.12-1.13
Above this level, the targets will be 1.28 and 1.38, then 1.68 extending to 1.82

ACAMDif the stock confirm a rebound from false break
That mean the stock change the behavior to uptrend.
