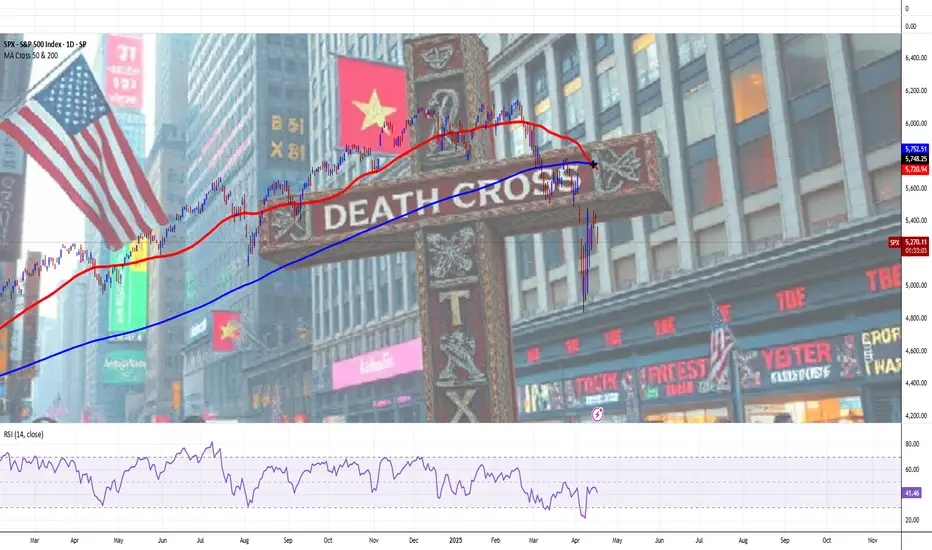
S&P 500 Index Goes 'Death Crossed' Again, Due To Unruly EconomyThe "Death Cross" is a technical chart pattern signaling potential bearish momentum in the US stock market, occurring when a short-term moving average (typically the 50-day) crosses below a long-term moving average (usually the 200-day).
Despite its foreboding name, historical data shows its implications are often less dire than perceived, serving as a coincident indicator of market weakness rather than a definitive predictor of collapse.
Historical Examples and Market Impact
The death cross gained notoriety for preceding major market downturns:
2000 Dot-Com Bubble: The Nasdaq Composite’s death cross in June 2000 coincided with the burst of the tech bubble, leading to a prolonged bear market.
2008 Financial Crisis: The S&P 500’s death cross in December 2007 foreshadowed the 2008 crash, with the index losing over 50% of its value by early 2009.
2020 COVID-19 Crash: The S&P 500, Dow Jones, and Nasdaq 100 all formed death crosses in March 2020 amid pandemic-driven panic, though markets rebounded sharply within months.
2022 Ukraine's War Crisis: The S&P 500, Dow Jones, and Nasdaq 100 all formed death crosses in March 2022 due to proinflationary surge on Ukraine's war and Arab-Israel conflict, leading to a prolonged bear market within next twelve months, up to March quarter in the year 2023.
These examples highlight the pattern’s association with extreme volatility, but its predictive power is inconsistent. For instance, the 2022 death cross in the S&P 500—its first in two years—occurred amid Fed rate hikes and geopolitical tensions, yet the market stabilized within weeks rather than entering a prolonged downturn.
Perspectives on Reliability and Use Cases
While the death cross reflects deteriorating short-term momentum, its utility depends on context:
Lagging Nature: As a lagging indicator, it confirms existing trends rather than forecasting new ones. The 50-day average crossing below the 200-day often occurs after prices have already declined.
False Signals: Post-2020 data shows the S&P 500 gained an average of 6.3% one year after a death cross, with Nasdaq Composite returns doubling typical averages six months post-cross.
Combined Analysis: Traders pair it with metrics like trading volume or MACD (Moving Average Convergence Divergence) to validate signals. Higher selling volume during a death cross strengthens its bearish case.
Strategic Implications for Investors
For market participants, the death cross serves as a cautionary tool rather than a standalone sell signal:
Short-Term Traders: May use it to hedge long positions or initiate short bets, particularly if corroborated by weakening fundamentals.
Long-Term Investors: Often treat it as a reminder to reassess portfolio diversification, especially during elevated valuations or macroeconomic uncertainty.
Contrarian Opportunities: Historical rebounds post-death cross—such as the 7.2% Nasdaq gain three months after the signal—suggest potential buying opportunities for risk-tolerant investors.
Fundamental Challenge
Stocks Extend Drop as Powell Sees Economy ‘Moving Away’ From Fed Goals
Powell sees economy ‘moving away’ from job, price goals due to Trump's tariff chainsaw.
Fed well positioned to wait for policy clarity. Strong jobs market depends on price stability, he adds.
Stocks extend declines, bonds rally as Fed chair speaks.
Conclusion
The "Death Cross" remains a contentious yet widely monitored pattern. Its dramatic name and association with past crises amplify its psychological impact, but empirical evidence underscores its role as one of many tools in technical analysis. Investors who contextualize it with broader market data—such as earnings trends, interest rates, and macroeconomic indicators—are better positioned to navigate its signals.
While it may foreshadow turbulence, its historical track record emphasizes resilience, with markets often recovering losses within months of the pattern’s appearance.
--
Best wishes,
Your Beloved @PandorraResearch Team 😎
// Think Big. Risk Less
Americasucks
USD/JPY. A simple, multi-year trend breakthroughThe Americans have become so utterly unpredictable, Dollar contunues its crash.
The main USDJPY graph indicates on a multi-year trend breakthrough.

Apparatchik Trump Says 'No.. More Pain' Ahead of Amazon EarningsPresident Trump's new tariffs have had a significant negative impact on Amazon's stock performance, revenue, and earnings, primarily due to increased costs and supply chain disruptions.
Here below is a detailed analysis of these effects.
Impact on Amazon's Stock Performance
Amazon's stock has seen substantial declines following the announcement of Trump's tariff plan. The company's shares dropped nearly 7% within two days of the announcement and are down nearly 21% year-to-date. These tariffs have exacerbated existing challenges for Amazon, which was already struggling in early 2025 with a 13% decline in stock value during the first quarter. The broader market also suffered, with technology stocks experiencing sharp declines as investors reacted to fears of higher costs and inflation.
Revenue Challenges
Amazon's reliance on Chinese suppliers for merchandise has made it particularly vulnerable to the newly imposed tariffs. Over 50% of Amazon's top third-party sellers are based in China, and many of their products are subject to hefty import taxes, including a 34% tariff on Chinese goods. These tariffs increase landed costs for a significant portion of Amazon's inventory, forcing sellers to either absorb the additional expenses or pass them on to consumers through higher prices. This could lead to reduced consumer demand, as higher prices may deter shoppers from purchasing goods on Amazon's platform.
Additionally, the elimination of duty exemptions on minor imports—previously advantageous for discount platforms such as Temu and Shein—has disrupted Amazon's competitive pricing strategy. While this change may level the playing field among e-commerce platforms, it also raises operational costs for Amazon's marketplace vendors who had relied on these exemptions.
Earnings Pressure
The tariffs are projected to slash Amazon's annual operating profits by $5 billion to $10 billion due to increased merchandise costs. Goldman Sachs estimates that these costs could rise by 15% to 20%, further straining profitability. While Amazon has historically maintained lower prices compared to competitors, absorbing these increased expenses without raising prices significantly may be unsustainable in the long term.
Moreover, fears of inflation resurgence due to Trump's trade policies could further dampen consumer purchasing power. This would likely lead to lower sales volumes and additional pressure on profit margins across Amazon's retail operations.
Potential Mitigation Strategies
To counteract these challenges, Amazon may implement several measures:
Vendor Negotiations. The company could negotiate with suppliers to share the burden of increased input costs rather than bearing them entirely.
Price Adjustments. Selective price increases on certain products may help offset rising costs without alienating customers entirely.
Supply Chain Diversification. Shifting sourcing away from heavily tariffed regions like China or focusing more on domestic suppliers could reduce exposure to trade disruptions.
Focus on Services. Amazon’s cloud division, AWS, contributes significantly to its operating income (58% in Q4 2024) and remains largely unaffected by tariffs. Increased emphasis on AWS could help mitigate losses from retail operations.
Technical challenge
The main technical graph indicates on Bearish market in development, with nearly 30% potential to further decline, down to major 10-year average support.
Conclusion
Trump’s tariffs have created substantial headwinds for Amazon by driving up costs and disrupting its supply chain. These challenges have led to stock declines, reduced revenue potential, and significant earnings pressure. While Amazon is exploring mitigation strategies such as vendor negotiations and diversification, the long-term impact will depend on how effectively the company adapts its operations amidst ongoing trade tensions.
--
Best 'Apparatchik' wishes,
PandorraResearch Team 😎

Trump Goes 'Cynosure' of All Eyes as He Walked Into '1930' RoomThe Striking Parallels Between Trump's 2025 Tariffs and the Smoot-Hawley Tariff Act of 1930
The recent trade policies under President Trump's second administration bear remarkable similarities to the controversial Smoot-Hawley Tariff Act of 1930, both in approach and potential consequences. These parallels offer important historical lessons about protectionist trade policies.
Protectionist Foundations and Scope
Both trade initiatives share fundamentally protectionist motivations aimed at shielding American industries from foreign competition. The Smoot-Hawley Act increased import duties by approximately 20% with the initial goal of protecting struggling U.S. farmers from European agricultural imports. Similarly, Trump's 2025 trade agenda explicitly aims at "backing the United States away from integration with the global economy and steering the country toward becoming more self-contained".
What began as targeted protections in both eras quickly expanded in scope. While Smoot-Hawley initially focused on agricultural protections, industry lobbyists soon demanded similar protections for their sectors. Trump's tariffs have followed a comparable pattern, beginning with specific sectors but rapidly expanding to affect a broad range of imports, with projected tariffs exceeding $1.4 trillion by April 2025—nearly four times the $380 billion imposed during his first administration.
Specific Tariff Examples
The parallel implementation approaches are notable:
Trump imposed a 25% global tariff on steel and aluminum products effective March 12, 2025
Trump raised tariffs on all Chinese imports to 20% on March 4, 2025
Trump imposed 25% tariffs on most Canadian and Mexican goods
Smoot-Hawley increased overall import duties by approximately 20%
Smoot-Hawley raised the average import tax on foreign goods to about 40% (following the Fordney-McCumber Act of 1922)
Global Retaliation and Economic Consequences
Perhaps the most striking similarity is the international backlash. The Smoot-Hawley tariffs triggered retaliatory measures from over 25 countries, dramatically reducing global trade and worsening the Great Depression. Trump's 2025 tariffs have already prompted counter-tariffs from major trading partners:
China responded with 15% tariffs on U.S. coal and liquefied natural gas, and 10% on oil and agricultural machines
Canada implemented 25% tariffs on approximately CA$30 billion of U.S. goods
The European Union announced tariffs on €4.5 billion of U.S. consumer goods and €18 billion of U.S. steel and agricultural products
Expert Opposition
Both policies faced significant opposition from economic experts. More than 1,000 economists urged President Hoover to veto the Smoot-Hawley Act.
Trump's 2025 tariffs? Reaction is coming yet...
Potential Economic Impact
The historical record suggests caution. The Smoot-Hawley Act is "now widely blamed for worsening the severity of the Great Depression in the U.S. and around the world". Trump's "more audacious intervention" similarly carries "potentially seismic consequences for jobs, prices, diplomatic relations and the global trading system".
These striking parallels between trade policies nearly a century apart demonstrate that economic nationalism and retaliatory trade cycles remain persistent challenges in international commerce, with historical lessons that remain relevant today.
Stock market Impact
Just watch the graph..
--
Best wishes,
Your Beloved @PandorraResearch Team 😎

Wall Street vs GoldZilla. The End of 'Irrational Exuberance' Era"Irrational exuberance" is the phrase used by the then-Federal Reserve Board chairman, Alan Greenspan, in a speech given at the American Enterprise Institute during the dot-com bubble of the 1990s. The phrase was interpreted as a warning that the stock market might be overvalued.
Origin
Greenspan's comment was made during a televised speech on December 5, 1996 (emphasis added in excerpt)
Clearly, sustained low inflation implies less uncertainty about the future, and lower risk premiums imply higher prices of stocks and other earning assets. We can see that in the inverse relationship exhibited by price/earnings ratios and the rate of inflation in the past. But how do we know when irrational exuberance has unduly escalated asset values, which then become subject to unexpected and prolonged contractions as they have in Japan over the past decade?
Greenspan wrote in his 2008 book that the phrase occurred to him in the bathtub while he was writing a speech.
The irony of the phrase and its aftermath lies in Greenspan's widely held reputation as the most artful practitioner of Fedspeak, often known as Greenspeak, in the modern televised era. The speech coincided with the rise of dedicated financial TV channels around the world that would broadcast his comments live, such as CNBC. Greenspan's idea was to obfuscate his true opinion in long complex sentences with obscure words so as to intentionally mute any strong market response.
The phrase was also used by Yale professor Robert J. Shiller, who was reportedly Greenspan's source for the phrase. Shiller used it as the title of his book, Irrational Exuberance, first published in 2000, where Shiller states:
Irrational exuberance is the psychological basis of a speculative bubble. I define a speculative bubble as a situation in which news of price increases spurs investor enthusiasm, which spreads by psychological contagion from person to person, in the process amplifying stories that might justify the price increases, and bringing in a larger and larger class of investors who, despite doubts about the real value of an investment, are drawn to it partly by envy of others' successes and partly through a gamblers' excitement.
The main technical graph represents a value of S&P500 Index in Gold troy ounces (current value 1.81 at time of writing this article), indicates that effusive Bull stock market goes collapsing.
--
Best wishes,
Your Beloved @PandorraResearch Team 😎

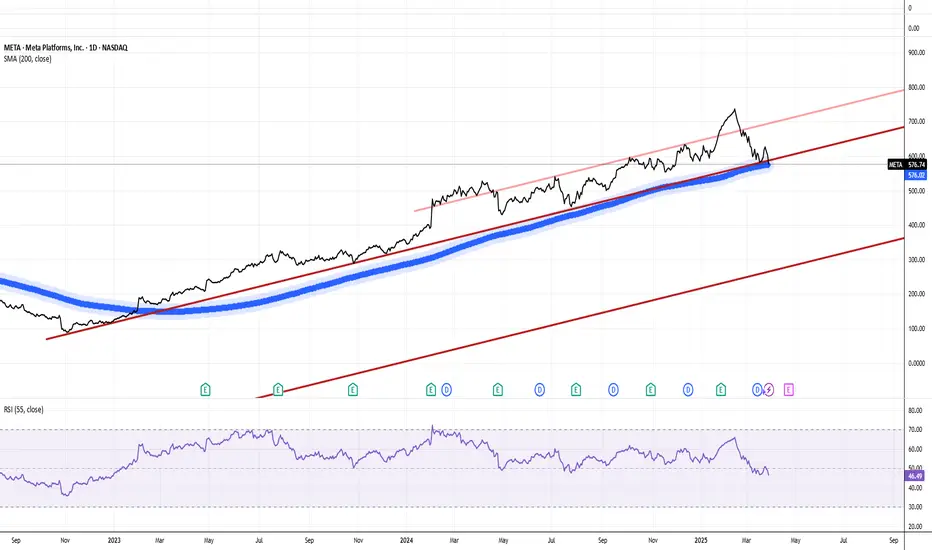
Meta Stock Goes 'Untoward', Fall Off The Cliff 200-Day SMAMeta's Descent into Bearish Territory. Understanding the 2025 Stock Crash
Meta Platforms has recently slipped into bearish territory, with its stock experiencing a significant downturn in early 2025. As of March 31, 2025, Meta shares trade at $576.74, reflecting more than 20.0% decline over the past month and erasing all year-to-date gains. This analysis examines the key factors driving Meta's bearish turn and what it means for investors.
Disappointing Financial Outlook and Investment Costs
Meta's stock decline comes despite previously strong performance, with the company's shares shedding 22% from their February 18, 2025 peak. Although Meta reported robust Q4 2024 profits, its outlook for Q1 2025 has significantly disappointed investors. The company's forward-looking EPS for Q1 2025 is projected at $5.25, raising sustainability concerns despite the previous quarter's EPS of $8.02 beating estimates.
A major contributor to investor anxiety is Meta's massive capital expenditure plans. The company has projected spending $60-$65 billion in 2025 on AI infrastructure alone, raising concerns about cash flow strain if revenue growth falters. These high fixed costs associated with AI investments, including data centers and engineering talent, create particular vulnerability during economic downturns.
Metaverse Losses Continue to Drain Resources
The company's Reality Labs division, responsible for virtual and augmented reality initiatives, continues to be a significant financial drag. This division lost $13.7 billion in 2022 alone with no clear path to profitability. Despite CEO Mark Zuckerberg's continued commitment to the metaverse vision, investor sentiment has soured on these costly experiments as they continue to consume capital without generating meaningful returns.
Broader Market Pressures and Industry Positioning
Meta's decline isn't occurring in isolation. It represents the last of the "Magnificent Seven" tech stocks to turn negative for the year, with the Bloomberg Magnificent 7 Total Return Index down 16% in 2025. The Nasdaq Composite has faced significant correction, declining 7.3% year-to-date and over 12% from its peak.
This market-wide pressure stems from persistent inflation concerns, Federal Reserve interest rate policies, and growing recession fears, creating a particularly challenging environment for growth-oriented technology stocks like Meta.
Influential Market Moves and Analyst Adjustments
Notable market participants have signaled caution regarding Meta's prospects. Cathie Wood's ARK Invest sold over $7 million in Meta stock (12,000 shares) on March 18, 2025—its first Meta sell-off in nearly a year. This high-profile divestment has further fueled bearish sentiment among investors.
Similarly, analysts have begun adjusting their outlook. KeyBanc Capital Markets recently downgraded its price target on Meta from $750 to $710, citing "greater macro uncertainty" and competitive pressures. This downgrade reflects growing concerns about Meta's ability to maintain growth momentum in the current economic climate.
External Challenges Mounting
Meta faces increasing competitive threats from platforms like TikTok and Snapchat, which continue to draw user attention and advertising dollars. Additionally, regulatory headwinds loom large, with an upcoming FTC trial on April 14, 2025, potentially forcing Meta to divest Instagram and WhatsApp—a prospect that has further spooked investors.
In conclusion, Meta stock now stands at a critical juncture, with investors carefully watching whether this represents a temporary correction or the beginning of a more prolonged bearish phase.
--
Best wishes,
Your Beloved @PandorraResearch Team 😎
Gold Prices Doubled in 5 years. What Does It 'Historically' MeanOver the past five years, Gold prices OANDA:XAUUSD have experienced a significant surge, doubling in value over the past 5 years, from mid-March 2020 to mid-March 2025.
This is the 3rd time in history ever, the price of gold doubled in U.S. dollars (we counted only events when it has been observed first time only over 5-years time span).
🥇 The 1st time "A Doubling" event happened in the first quarter of 1973, when Gold hit $80 mark per ounce (google: "1973 Arab–Israeli War").
⚒ What happened next with Gold prices after that? - Hmm.. Gold doubled in price again! (and even more) over the next three years. Watch historical charts to learn more.
⚒ S&P500 Index folded in half over the same next three years.
🥇 The 2nd time "A Doubling" event happened more than 30 years later, in the first quarter of 2006 when Gold prices hit $500 barrier by the end of the year 2005, for the first time since 1987.
Some analysts blamed inflation in the US and concerns about the state of the global economy.
⚒ What happened next with Gold price after that? - Hmm.... Gold price also doubled in price again! (and even more) over next three years. Watch again historical charts to learn more.
⚒ S&P500 Index folded in half again over the same next three years (google: "2008 financial crisis").
🥇 Now is the 3rd time "A Doubling" event has happened with Gold prices, first time over last almost 20 years.
Several factors have contributed to this increase, including economic uncertainty, inflation fears, geopolitical tensions, central bank activity, and investment demand.
Economic Uncertainty: Times of economic turmoil often drive investors towards gold as a safe haven asset. The increase in global economic uncertainty has been a primary driver of gold's price surge.
Inflation: The threat of inflation also contributes to the rising price of gold. Investors often turn to gold as a hedge against the devaluation of fiat currencies during inflationary periods.
Geopolitical Tensions: Geopolitical instability encourages investors to seek safe-haven assets like gold. The Ukraine war, along with conflicts in the Middle East, have further fueled the rise in gold prices.
Central Bank Demand: Central banks' buying and easing cycles influence gold prices. Central banks often purchase gold to diversify their reserve holdings, and this demand can impact gold prices significantly.
Investment Demand: Demand from technology, jewelry, and investors influences gold prices. Gold price movements are sometimes driven by investor demand.
--
Best #GODL (Gold On Dear Life) wishes,
@PandorraResearch Team

NDX v SPX. Nerd America comes closer to the Nerd sunsetThe main graph represents NDX v SPX ratio.
Like 25 years ago, new super duper brave generation of Nerd America comes closer to the next one Nerd sunset.
