A new signal to maintain purchasesTo date, we have passed the middle of the month, I want to consider the prospects for the end of the year. The second half of the month opened positively on the air above 3750 and 3850, which gives signals to exit above 4000 in order to test the 4250-4500 range. This is a positive signal for altcoins, and therefore we have seen new growth impulses for coins for the upcoming continuation of the trend. Bitcoin opened the second half of the month above 100k, which reduces the probability of a retest of 75-85k in the near future. However, an opening below 102.5 gives a signal for a flat of about 100k with attempts to go lower. With this picture, it is likely to go to the 110-115k test with a further return to 100k by the end of the year, which will lead to a rollback on the air, even taking into account positive signals.
According to the overall picture, the probability of growth this week prevails as part of the continuation of the trend of the current month and quarter. But from next week until the end of the year, it is worth keeping in mind the likelihood of a new wave of pullback in the market according to the annual schedule, which may continue in January. With such a picture, it is worth being careful about overbought coins with large capitalization. As I wrote earlier, the rollback on such coins, which began at the first market disruption at the beginning of the month, may continue until the end of the year with the transition to active sales in the new year. More interesting are the oversold coins, which continue to turn the annual candle into a bullish one.
New waves of growth on the local market, in particular, can be expected for VIB. Signals have been left for further overshooting and in the event of a breakdown from the third wave of 0.125, the road to the range of 0.15-25 will open. Growth is still going against the entrenched bearish trend on the monthly chart, giving rebounds from key levels and new opportunities for safe earnings without excessive overbought.
A local replay can also show OG TROY AST. According to OG, there are clear signals for a retest of 7.5-9$ at least. The token has quite a lot of liquidity, which provides sharp breakouts.
TROY, along with OG, has signals for further overshooting. In the case of a 0.0075 breakdown, there is a probability of a powerful growth wave for the 0.0125-150 test. At the moment, we are working out the sales momentum of 0.0035, which occurred before the last wave of growth. From 0.035-40 from the third wave, there is already a chance to break above 0.0075. However, with a negative market, there is a probability of a breakdown to 0.0250-275 before the start of growth on the move.
AST has targets at 0.21-25, where it can break through in case of consolidation above 0.15. However, incomplete emission exerts additional pressure, which leads to trend disruptions and increases the likelihood of a breakdown as we approach the end of the year.
This month, there has not yet been a new delisting announcement, which threatens the dynamics of coins with the monitoring tag. If there is no announcement in the next couple of days, I will be looking at new AKRO and VITE purchases in the second half of the week. Also, with them, HARD can give a new impetus. However, the threat of delisting next week is likely to make the growth waves quite short-term.
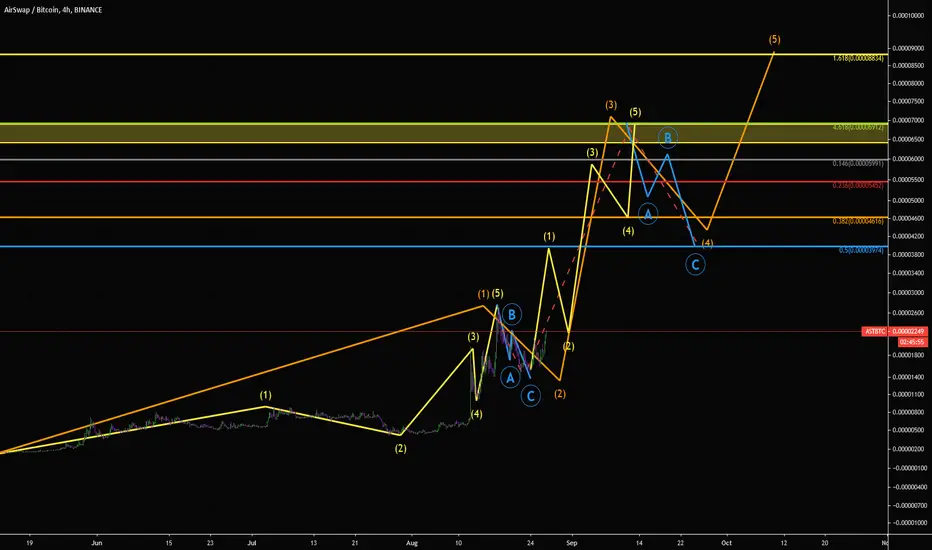
AST-BTC

High probability of market growth before the end of the yearToday, as the market strengthens, I want to consider the prospects for the new week. This week, the broadcast has worked very technically, according to the planned scenario. The most important is the opening of the second half of the month and quarter above 3000. This, along with the positive opening of the half-year and quarter, gives a signal for continued purchases with a high probability until the end of the year. Due to the positive signals, I expect purchases to continue until the close of this week with an attempt to open a new candle above 3250, which will give the green light to test the key level of 3500 in the coming week. However, I would like to note an extremely negative factor – the market is growing against a rapidly strengthening dollar. In the absence of a dollar reversal on the crypt, there is a high probability of an attempt to align the correlation with the reversal of the current monthly candle into a bearish one. According to the cue ball, this will threaten to retest 75k. Insurance against a reversal of the month may be a local move on a new weekly candle, which will make the rollback false with a quick payback, or exclude it.
Due to the positive picture on the tops today and tomorrow, the probability of a reversal of the weekly candlesticks on the alt is bullish with new local trends. Next week, due to an attempt to move over the tops, the probability of continued growth of buyers for alt is prevailing, however, due to the threat of a reversal of the month, it is worth being on the alert and from the next high on the weekly candle, keep in mind the likelihood of a major pullback on coins. After the consolidation of the tops, the dominance of altcoins began to grow with the aim of reaching above 10%, which will support the alt market in the new week with a flat or pullback on the tops.
I still mainly consider oversold coins for work, because in an overheated market they have a high probability of growth, which we once again saw this week. Vib remains the most interesting so far, with a possible breakdown in the range of 0.15-25. Also, in the average period, gft remains very interesting with a retest potential of 0.025-35 at least. Given the high liquidity, the trend for it can be quite stable.
Vite has already fulfilled its potential this week, as the movement above contradicts the indicators and the formed bearish trend. I think new entries should be considered already in the new weekly candle, if there is no announcement about delisting in the first half or it will not enter there. Unlike vite, oax, although it showed good volatility, but having targets at 0.25-35 and a practically extinguished bearish trend on the indicators, it may try to give a break through the week today or tomorrow. Next, I will also consider it for work in the second half of the new week.
Ast firo and akro may also be interesting for scalping in the new week, with possible growth waves of up to 50%+.

GFT has set the stage for a trend changeToday I want to consider the position on GFT, which, along with VIB, I am considering to work first. The second half of the quarter opened above 0.015, which gives a signal to maintain purchases. The re-trading in the range of 0.0150-75 is almost finished, and when fixed above the upper limit, you can prepare for a transition to the flat range near the key level for volatility growth of 0.025 +-0.0025. In case of a successful breakdown of 0.025, the road will open to 0.035 and 0.050. In a positive scenario, a new monthly candle will open above 0.025, in which case the continuation of the trend will be quite confident. With a more negative market from the 0.025 test, we can see a pullback, in which case a new opportunity will be formed to profitably top up the position in order to continue the trend in the new month. As I have mentioned more than once, GFT has very high liquidity due to its wide presence on exchanges and the availability of derivatives. The only thing keeping the price from the rocket is the monitoring tag on the binance, which I think will be removed in the future.
A similar reversal pattern was worked out on VITE. Technically, the picture is similar.

Attempt to move the month by ASTIn addition to the risky option for scalping, which can bring profits commensurate with the spent PROS, I am still considering more reliable options for work, without the monitoring, VIB and AST tag. AST has an incomplete issue, which is a pitfall and creates a risk of price drawdown in the event of an increase in the number of coins in circulation. There was also a delisting with OKX, which raises suspicions. However, no coins have been added yet and the exit from the triangle down turned out to be false. An optimistic overall market picture also contributes to purchases. In addition, the month and, more importantly, the second half of the quarter opened above the key support of 0.75. Technically, we have a signal for an attempt to reverse the annual candle, which is happening now on the alt, with an attempt at a new annual high.
In the case of working out the exit from the triangle upwards, the minimum goal is to surpass the previous month with a test of the range 0.125-150. If a new month opens above 0.125 before the end of the year, there is a high probability of a 0.25 retest. A volatile scenario with a breakdown of 150 is also possible this month. The breakdown of the descending triangle has already occurred, which gives a signal for a trend reversal.
In addition to VIB and AST, I consider GFT as a fairly safe investment option. I still think that the monitoring tag is a temporary measure for him to work out loyalties. High liquidity due to the presence on many exchanges and the availability of derivatives provide the token with a growth potential of several x's. If the tag is changed, the market reaction will not take long.

OAX continues to prepare to work out the accumulated potentialToday, OAX can continue to please with profits. The token ends, together with vib, the cancellation of the bearish trend formed on the weekly and monthly charts. In the process of investing against this trend, he gave several impulses of 50%+ and more than ten opportunities to earn 30%+. In my opinion, such trading is much more interesting than a trend with blurred goals and a long drawdown in the event of a market collapse, so I consider such coins to trade first.
But today, in addition to the opportunities for profitable scalping, I want to consider the main medium-term picture and the growing probability of the main wave of growth. As I expected, before opening a new monthly candle, an attempt was made to retest the 0.25 level, which is key for the growth of volatility, but the negative overall dynamics of the market did not provide sufficient volatility. However, the gradual growth of the trend accelerated, which allowed the second half of the quarter to open above 0.175, providing a clear technical signal for a transition to the range 0.25-35 and growth in the second half of the quarter. Indirectly, this hints at the fact that delisting of the token is probably not in danger yet.
To date, there is still an opportunity to break through to 0.25 this week in case of sufficient volatility in the market. The signal for this may be a move over the ether of yesterday's day or a hike on the alt index above 9.75% with an attempt to break 10%. In the absence of sufficient volatility, we can expect a small pullback at the beginning of the week to draw a shadow on a new weekly candle under the fear of delisting, characteristic of all coins with the monitoring tag, and a subsequent powerful breakdown in the second half of the week as part of a trend change on the weekly chart to bullish. To understand the medium-term picture and growth potential, it is worth considering the monthly and weekly chart where the second bottom has formed. On the monthly chart, the OAX pattern is very similar to PROS. Technically, the growth potential reaches 0.75-1.0. Except for oax and vib, there are no oversold coins with a similar growth potential on binance.
The most dangerous tools that are under development have the greatest growth potential, as we have already seen with the example of pros and troy, but there is still the possibility of delisting in case of problems with the project. In this regard, I want to repeat once again and remind you of the need to carefully weigh money management, choosing a moderate position on dangerous instruments to insure against large losses in the event of an error, delisting or prolonged drawdown. It is also a priority to trade coins with a monitoring tag in the second half of the week, because Delistings were most often in the first half.

AST to Swap trend! AST/BTCTMA: 50 line (Cyan), 100 line (Green), 200 line (Red).
MC ancor wave
MACD
Fib ret To the green lvl

AST - So Much More To Give Us!🚀🚀It turns out AST is going on an absolute tear - who would have seen that coming! Oh wait -
Sorry had to fluff myself up a little there right? So looking like the gators mouth is wide open here, essentially a reverse consolidation wedge if you think about it that way - the price swings will get wilder and more volatile with time.
Luckily the aligator is pointing upwards here and it looks like there's no much down room left on this chart at this point.
I expect AST to hit $1+ USD which would put us around here for long term targets. BUT fact is AST is a great project and something of a sleeper that deserves more attention than it has historically gotten.

AST - About to go absolute Insane🚀💎AIRSWAP, AST, recently had some pretty big news and is fundamentally a fantastic project.
VERY bullish here with rsi in launch zone after a retrace. TONNES of headroom.
Looking very very bullish on tether charts and expect this to get absolutely crazy numbers over the coming days/weeks.


AST/BTC very simple tradeFundamentally sound project, place in DeFi space.
Simple trade, accumulate below 300, stop loss 200
1st target 400
2nd target 600
3rd target 800
No financial advise, simple trade setup used for training.

ASTBTC support and resistanceThis is how I see it - the price will bounce off the new support at around 345 to about 360 and will bouce off the same support again.


There is a possibility for the beginning of an uptrend in ASTBTCTechnical analysis:
. AirSwap/Bitcoin is in a range bound and the beginning of uptrend is expected.
. The price is below the 21-Day WEMA which acts as a dynamic resistance.
. The RSI is at 49.
. While the price downtrend in the daily chart is not broken, bearish wave in price would continue.
Trading suggestion:
. There is a possibility of temporary retracement to suggested support zone (0.00000540 to 0.00000383). if so, traders can set orders based on Price Action and expect to reach short-term targets.
Beginning of entry zone (0.00000540)
Ending of entry zone (0.00000383)
Entry signal:
Signal to enter the market occurs when the price comes to " Buy zone " then forms one of the reversal patterns, whether " Bullish Engulfing ", " Hammer " or " Valley " in other words,
NO entry signal when the price comes to the zone BUT after any of the reversal patterns is formed in the zone.
To learn more about " Entry signal " and the special version of our " Price Action " strategy FOLLOW our lessons:
Take Profits:
TP1= @ 0.00000675
TP2= @ 0.00000801
TP3= @ 0.00000892
TP4= @ 0.00001072
TP5= @ 0.00001277
TP6= @ 0.00001517
TP7= @ 0.00001830
TP8= @ 0.00002430
TP9= @ 0.00004033
TP10= Free

There is a possibility for the beginning of an uptrend in ASTBTCTechnical analysis:
. AirSwap/Bitcoin is in a range bound and the beginning of uptrend is expected.
. The price is below the 21-Day WEMA which acts as a dynamic resistance.
. The RSI is at 48.
. While the price downtrend in the daily chart are not broken, bearish wave in price would continue.
. The RSI downtrend is broken, so the probability of the resumption of an uptrend is increased.
Trading suggestion:
. There is a possibility of temporary retracement to suggested support zone (0.00000558 to 0.00000383). if so, traders can set orders based on Price Action and expect to reach short-term targets.
Beginning of entry zone (0.00000558)
Ending of entry zone (0.00000383)
Entry signal:
Signal to enter the market occurs when the price comes to " Buy zone " then forms one of the reversal patterns, whether " Bullish Engulfing ", " Hammer " or " Valley " in other words,
NO entry signal when the price comes to the zone BUT after any of the reversal patterns is formed in the zone.
To learn more about " Entry signal " and the special version of our " Price Action " strategy FOLLOW our lessons:
Take Profits:
TP1= @ 0.00000801
TP2= @ 0.00000892
TP3= @ 0.00001072
TP4= @ 0.00001277
TP5= @ 0.00001517
TP6= @ 0.00001830
TP7= @ 0.00002430
TP8= @ 0.00004033
TP9= @ 0.00006486
TP10= Free

AST Looks BullishAST has a strong upward trend for roughly 50 days. It is above EMA14, EMA50 and EMA100.
Buy: Up to: 1010
Sell Target:
1079
1183
1250
1390
Stop Loss: Close daily candle below 870

ASTBTC just perfect!Very good buying opportunity and can give you some nice profit in mid-term.
In my opinion, it can grow 500-600 percent in long-term (maybe mid-term :) )
Buy a confirmed break above 1050
Targets
1400
1650
1950
2200
Stop loss 1050.

AST/BTC Broke the previous high, waiting for a retraceSince we've seen those recent highs broken, maybe a good retrace for a BUY would be around the 1635 level which falls within the 1H orderblock between .62 and .705 fib levels, plus that's near the level of the previous high that we have broken with this impulse. This idea comes with a stop below that 1453 recent low.

