Bullish-signal


NZDCAD | Trade No.4/5Canadian dollar continues it's weak streak and influences from the Australian and New Zealand economies are now reacting. Taking 50% of profits by 100 pips and letting the trade run.
-This idea is to clear up the confusion from Trade No.4.
Trade at your own risk under your own terms. I'm not responsible for anyone's decision to follow MY idea.


eurchf long opportunitythis is a compound trade for me as I am still holding my original buys from the initial impulse move to the upside.


Bitcoin's bullish 1hr Inverse H&S pattern 26th Sept 2018 [BTFD] Just spotted an Inverse H&S pattern on the 1 hour chart
Cycle of Power moves up into bullish zone
also looking bullish on my MT4 terminal also
6800 on the cards short term and could push towards the 0.618 fib around 7400
use yesterdays educational chart as a guide for next peak...

ZECBTC High risk but profitable opportunityThe price penetrates Ichimoku cloud where the lines intersect each other. Moreover the green cloud is above the red which means the trend reversed and our buying zone acts now like a strong support.
At the 4-hour timeframe there is Bullish XABCD pattern which can help to break through descending triangle. Nevertheless there is no strong fundamental and technical background for subsequent growth, indicators are bearish. There should be a downtrend to the triangle zone again when the price reaches all our target.
However mentioned at the chart bounce can bring a good profit in the short term
4 signals including ZEC and BAT were posted in the Premium channel 2 hours ago. The rest 2 signals are kept in secret as the are based on insider info and can bring huge x2-3 gains. Do not miss the opportunity

KMDBTC retracement movementThe price broken down through the strongest support, however it seems that market players do not want to trade this coin at the lower price. Indicators become bullish, EMA 20 is going to intersect the rest EMA lines while there is hidden bullish divergence and Gartley butterfly.
The price will pump back to the Fib 1 retracement level and then it will be possible to scalp using our targets. Stay tuned for updates

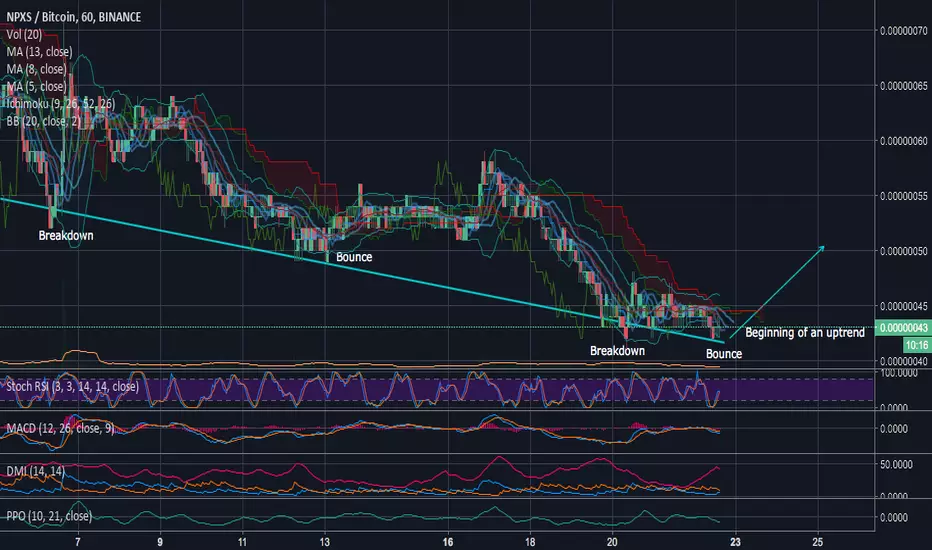
NPXSBTC consolidation is overOne of the new coins on Binance, faced a correction wave after listing. At the previous time we analyzed this coin it was at the side trend around 0.00000065, however it went down due to BTC fall. You can see a corrective pullback on the chart which is finished now and the price is again in the side trend. From this point it can bounce and go up to the previous height. Carefully track this coin and our updates
There is a great potential to move higher, and the price range provides a good entry opportunity. DMI shows a great possibility of impulse bounce, MACD and Stoch RSI intersected in a bullish critical area. We recommend this coin for medium term trade.
Signal was posted in the Premium channel 1 hour ago.
SYSBTC descending wedge bounceThe market has a good potential to touch the upper edge of the falling wedge. After breaking out of the triangle further growth is expected. The price will touch the first target then it will roll back a little and will go up again.
The price touched Fib 0.786 support level and is ready to bounce, indicators confirm it. Moreover the price is at the lower edge of the triangle and BB channel, if the price maintain this level there should be upward movement to the upper edge.
If the price goes below our STOP LOSS mention in the signal (the daylight candle will be closed below this level), we recommend to close the position and open it again with the same amount once it consolidates (we will inform you about it). However probability of the negative scenario is low

GOLOSBTC an opportunity after a global decreaseThe price tests a local resistance which is located around 0.00000890, where intersection of Ichi clouds change the trend. Consolidating above this level will start an impulsive wave of growth. If positive trend continues it will reach the next resistance levels around our target. Overall it is a mid term investment opportunity. Currently, price fluctuates in the analyzed range and seems a good entry.
