$OKTA is ready to RIP! 58% UpsideNASDAQ:OKTA was a big name I was talking about end of last year before we took a big dip in the markets...well we are back at the CupnHandle breakout level now and this trade looks ready to RIP!
Warning earnings on May 27th!
- Looking for a close on Friday above the breakout level for an entry here
- Green H5_L inidcator
- CupnHandle breakout
- Volume shelf launch
- Bullish Wr%
$139 First target
Measured Move is $186 for the cupnhandle
Not financial advice
Buy!!

GOLD BEST PLACE TO BUY FROM|LONG
GOLD SIGNAL
Trade Direction: long
Entry Level: 3,341.45
Target Level: 3,414.79
Stop Loss: 3,292.55
RISK PROFILE
Risk level: medium
Suggested risk: 1%
Timeframe: 2h
Disclosure: I am part of Trade Nation's Influencer program and receive a monthly fee for using their TradingView charts in my analysis.
✅LIKE AND COMMENT MY IDEAS✅

EUR/JPY LONG FROM SUPPORT
Hello, Friends!
EUR/JPY is making a bearish pullback on the 3H TF and is nearing the support line below while we are generally bullish biased on the pair due to our previous 1W candle analysis, thus making a trend-following long a good option for us with the target being the 163.264 level.
Disclosure: I am part of Trade Nation's Influencer program and receive a monthly fee for using their TradingView charts in my analysis.
✅LIKE AND COMMENT MY IDEAS✅

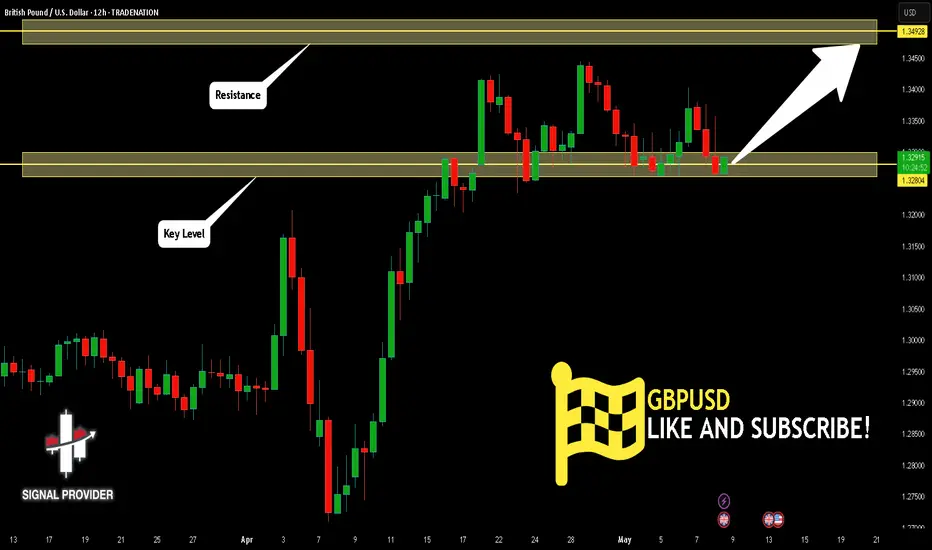
GBPUSD Is Bullish! Long!
Take a look at our analysis for GBPUSD.
Time Frame: 12h
Current Trend: Bullish
Sentiment: Oversold (based on 7-period RSI)
Forecast: Bullish
The market is testing a major horizontal structure 1.328.
Taking into consideration the structure & trend analysis, I believe that the market will reach 1.349 level soon.
P.S
Overbought describes a period of time where there has been a significant and consistent upward move in price over a period of time without much pullback.
Disclosure: I am part of Trade Nation's Influencer program and receive a monthly fee for using their TradingView charts in my analysis.
Like and subscribe and comment my ideas if you enjoy them!
COIN Coinbase Global Options Ahead of EarningsIf you haven`t bought COIN before the recent rally:
Now analyzing the options chain and the chart patterns of COIN Coinbase Global prior to the earnings report this week,
I would consider purchasing the 220usd strike price Calls with
an expiration date of 2025-8-15,
for a premium of approximately $18.90.
If these options prove to be profitable prior to the earnings release, I would sell at least half of them.
Disclosure: I am part of Trade Nation's Influencer program and receive a monthly fee for using their TradingView charts in my analysis.

MARA Holdings Options Ahead of EarningsIf you haven`t bought MARA before the recent rally:
Now analyzing the options chain and the chart patterns of MARA Holdings prior to the earnings report this week,
I would consider purchasing the 13usd strike price Calls with
an expiration date of 2025-5-30,
for a premium of approximately $1.38.
If these options prove to be profitable prior to the earnings release, I would sell at least half of them.

KODK Eastman Kodak Company Options Ahead of EarningsIf you haven`t bought KODK before the previous earnings:
Now analyzing the options chain and the chart patterns of KODK Eastman Kodak prior to the earnings report this week,
I would consider purchasing the 7.5usd strike price Calls with
an expiration date of 2026-1-16,
for a premium of approximately $0.92.
If these options prove to be profitable prior to the earnings release, I would sell at least half of them.

RKT Rocket Companies Options Ahead of EarningsIf you haven`t bought RKT before the previous earnings:
Now analyzing the options chain and the chart patterns of RKT Rocket Companies prior to the earnings report this week,
I would consider purchasing the 13usd strike price Calls with
an expiration date of 2026-1-16,
for a premium of approximately $1.37.
If these options prove to be profitable prior to the earnings release, I would sell at least half of them.

TTD The Trade Desk Options Ahead of EarningsIf you haven`t bought TTD before the recent rally:
Now analyzing the options chain and the chart patterns of TTD The Trade Desk prior to the earnings report this week,
I would consider purchasing the 55usd strike price Calls with
an expiration date of 2025-6-20,
for a premium of approximately $6.70.
If these options prove to be profitable prior to the earnings release, I would sell at least half of them.

RUM Rumble Options Ahead of EarningsIf you haven`t bought RUM before the recent rally:
Now analyzing the options chain and the chart patterns of RUM Rumble prior to the earnings report this week,
I would consider purchasing the 10usd strike price Calls with
an expiration date of 2025-11-21,
for a premium of approximately $1.20.
If these options prove to be profitable prior to the earnings release, I would sell at least half of them.

WULF TeraWulf Options Ahead of EarningsIf you haven`t bought WULF before the rally:
Now analyzing the options chain and the chart patterns of WULF TeraWulf prior to the earnings report this week,
I would consider purchasing the 2usd strike price Puts with
an expiration date of 2026-1-16,
for a premium of approximately $0.43.
If these options prove to be profitable prior to the earnings release, I would sell at least half of them.

QURE uniQure Options Ahead of EarningsAnalyzing the options chain and the chart patterns of QURE uniQure prior to the earnings report this week,
I would consider purchasing the 15usd strike price Calls with
an expiration date of 2026-1-16,
for a premium of approximately $2.32.
If these options prove to be profitable prior to the earnings release, I would sell at least half of them.

GBP/CHF BULLS ARE GAINING STRENGTH|LONG
GBP/CHF SIGNAL
Trade Direction: long
Entry Level: 1.098
Target Level: 1.103
Stop Loss: 1.095
RISK PROFILE
Risk level: medium
Suggested risk: 1%
Timeframe: 1h
Disclosure: I am part of Trade Nation's Influencer program and receive a monthly fee for using their TradingView charts in my analysis.
✅LIKE AND COMMENT MY IDEAS✅

GOLD BULLISH BIAS RIGHT NOW| LONG
GOLD SIGNAL
Trade Direction: long
Entry Level: 3,217.01
Target Level: 3,287.27
Stop Loss: 3,170.16
RISK PROFILE
Risk level: medium
Suggested risk: 1%
Timeframe: 3h
Disclosure: I am part of Trade Nation's Influencer program and receive a monthly fee for using their TradingView charts in my analysis.
✅LIKE AND COMMENT MY IDEAS✅

SILVER Is Going Up! Buy!
Here is our detailed technical review for SILVER.
Time Frame: 9h
Current Trend: Bullish
Sentiment: Oversold (based on 7-period RSI)
Forecast: Bullish
The market is approaching a significant support area 3,288.3.
The underlined horizontal cluster clearly indicates a highly probable bullish movement with target 3,391.4 level.
P.S
The term oversold refers to a condition where an asset has traded lower in price and has the potential for a price bounce.
Overbought refers to market scenarios where the instrument is traded considerably higher than its fair value. Overvaluation is caused by market sentiments when there is positive news.
Disclosure: I am part of Trade Nation's Influencer program and receive a monthly fee for using their TradingView charts in my analysis.
Like and subscribe and comment my ideas if you enjoy them!

Breakout confirmation: A daily close above $98K with strong vol📋 Trade Plan
Long bias remains valid above $93.5K.
Breakout confirmation: A daily close above GETTEX:98K with strong volume targets the $102.5K level.
Pullback Buy Zone: $93.5K–$94.5K if price respects support.
Caution: Overbought oscillators combined with resistance suggest a short-term pullback risk before continuation.
🟢 Long bias intact above $93.5K
🔴 Avoid fresh longs here. Wait for either breakout above GETTEX:98K or dip to support
🎯 Target: $102.5K on breakout
🛑 Invalidation: Close below $93.5K

Stellantis N.V.Key arguments in support of the idea
The company's shipments are projected to recover in the latter half of the year.
STLA's valuation appears significantly lower compared to its industry peers
Investment Thesis
Stellantis N.V. Stellantis N.V. (STLA), a leading global automotive manufacturer, stands as a dominant force in both North American and European markets. The company boasts a diverse and comprehensive portfolio of automobile brands, encompassing renowned names such as Jeep, Fiat, Peugeot, Maserati, Dodge, Opel, and Chrysler. Ranking among the top five automakers worldwide in passenger car shipments, Stellantis derives approximately 45% of its total revenue from its sales in North America.
Last week, the White House signaled a policy shift by announcing the easing of tariffs for the automotive industry, providing a potentially positive catalyst for automaker stocks. On April 3, the U.S. imposed a 25% tariff on the importation of foreign-manufactured automobiles. This measure will be extended to include similar duties on imported auto parts beginning May 3. The Big Three, namely Ford, General Motors, and Stellantis, produces a portion of its vehicles and several auto parts for the U.S. market in Canada and Mexico. Consequently, these companies
have experienced significant stock declines since the beginning of the year, attributable to the new tariffs. Notably, while three out of every five cars sold by Stellantis in the U.S. are assembled domestically, approximately 20% of their components are imported and thus subject to the 25% tariff. Last Tuesday, President Donald Trump unveiled relaxed tariffs on auto parts, permitting U.S. automakers to reclaim up to 3.75% of the car’s total cost at retail for previously paid duties. This tariff relief could substantially aid Stellantis in recuperating most of its tariff expenses. If 20% of all components in automobiles produced in the region are subject to the 25% tariff, the effective tariff cost on the total vehicle will be 5%, of which 3.75% can be reimbursed. Thus, without any immediate alterations to their supply chains—which they currently have no plans to modify—the duty on a U.S.- manufactured vehicle effectively reduces to 1.25% of its final retail price. While closures and suspensions of certain production sites are inevitable, the overall impact of these duties is less severe than anticipated just weeks prior. It is our assessment that these Big Three automobile manufacturers possess the resilience and strategic capability to navigate and adapt to the newly imposed tariff environment.
Stellantis is strategically realigning its model portfolio, signaling a potential recovery in its market share. In the first quarter of 2025, the automaker unveiled three new models and is poised to introduce an additional ten models aimed at the U.S. and European markets by year's end. This comes despite a 9% y/y decline in shipments during the first quarter. However, the company has managed to bolster its market share in Europe, a trend attributed to the invigorated product lineup. We anticipate that this revitalization will enable Stellantis to achieve a 7.8% y/y increase in shipments during the second half of the year, reaching 2.8 million units. Nonetheless, first-half shipments are expected to remain subdued, a development largely anticipated by current consensus estimates.
STLA shares remain notably undervalued within the automotive sector, presenting a more economical option compared to its peers. Currently, Stellantis is trading at a 2024 EV/EBITDA multiple of 1.4x, significantly lower than the median figure of 3.8x for the six largest U.S. automakers by market share. This year, the company is confronting a "double whammy" of challenges. In addition to contending with the potential financial burden of tariffs, Stellantis has also been grappling with substantial inventory levels—a repercussion of its waning pricing competitiveness. Despite these hurdles, we view this as a strategic opportunity to initiate a long position. It is anticipated that the automotive giant will navigate the emerging challenges of 2025 effectively.
Our target price for the Company is set at $11.3, with a "Buy" recommendation. To mitigate any potential downside risks, we suggest setting a stop-loss at $8.7.

doge buy midterm "🌟 Welcome to Golden Candle! 🌟
We're a team of 📈 passionate traders 📉 who love sharing our 🔍 technical analysis insights 🔎 with the TradingView community. 🌎
Our goal is to provide 💡 valuable perspectives 💡 on market trends and patterns, but 🚫 please note that our analyses are not intended as buy or sell recommendations. 🚫
Instead, they reflect our own 💭 personal attitudes and thoughts. 💭
Follow along and 📚 learn 📚 from our analyses! 📊💡"

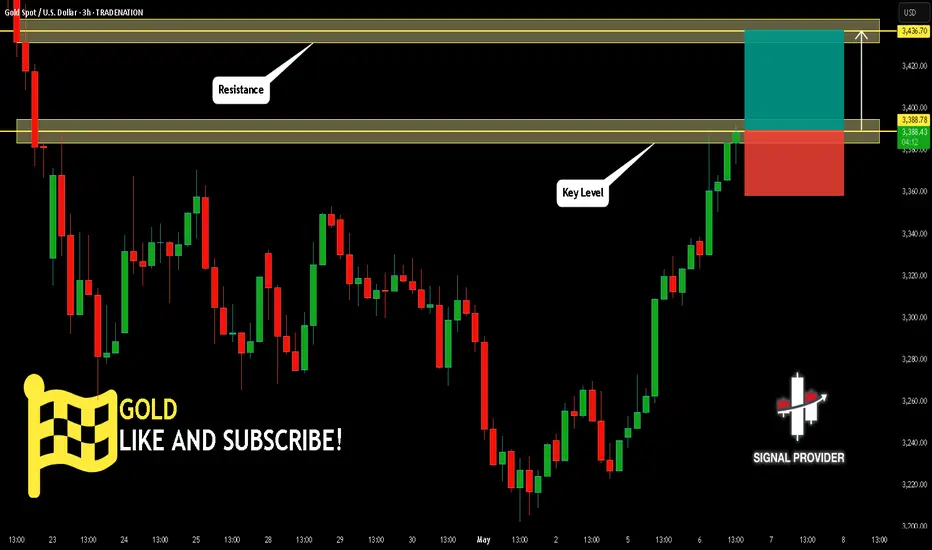
GOLD Will Go Up! Long!
Take a look at our analysis for GOLD.
Time Frame: 3h
Current Trend: Bullish
Sentiment: Oversold (based on 7-period RSI)
Forecast: Bullish
The market is testing a major horizontal structure 3,388.78.
Taking into consideration the structure & trend analysis, I believe that the market will reach 3,436.70 level soon.
P.S
The term oversold refers to a condition where an asset has traded lower in price and has the potential for a price bounce.
Overbought refers to market scenarios where the instrument is traded considerably higher than its fair value. Overvaluation is caused by market sentiments when there is positive news.
Disclosure: I am part of Trade Nation's Influencer program and receive a monthly fee for using their TradingView charts in my analysis.
Like and subscribe and comment my ideas if you enjoy them!
USDCAD Is Bullish! Long!
Here is our detailed technical review for USDCAD.
Time Frame: 12h
Current Trend: Bullish
Sentiment: Oversold (based on 7-period RSI)
Forecast: Bullish
The market is approaching a significant support area 1.378.
The underlined horizontal cluster clearly indicates a highly probable bullish movement with target 1.399 level.
P.S
Overbought describes a period of time where there has been a significant and consistent upward move in price over a period of time without much pullback.
Disclosure: I am part of Trade Nation's Influencer program and receive a monthly fee for using their TradingView charts in my analysis.
Like and subscribe and comment my ideas if you enjoy them!

GOLD Will Grow! Buy!
Please, check our technical outlook for GOLD.
Time Frame: 4h
Current Trend: Bullish
Sentiment: Oversold (based on 7-period RSI)
Forecast: Bullish
The market is approaching a key horizontal level 3,257.82.
Considering the today's price action, probabilities will be high to see a movement to 3,352.14.
P.S
We determine oversold/overbought condition with RSI indicator.
When it drops below 30 - the market is considered to be oversold.
When it bounces above 70 - the market is considered to be overbought.
Disclosure: I am part of Trade Nation's Influencer program and receive a monthly fee for using their TradingView charts in my analysis.
Like and subscribe and comment my ideas if you enjoy them!

Gold surges thanks to China buying goods, waiting for FED waveInternational gold prices jumped to 3,332 USD/ounce, up more than 72 USD compared to the bottom of last night's session. The main driving force came from the wave of gold buying in China, when concerns about the weakening economy caused people to massively turn to gold as a safe haven. The H4 chart shows a strong increase, EMA34 has crossed EMA89, establishing a clear short-term uptrend. If gold surpasses 3,340 USD, it is likely to head towards the old peak around 3,420–3,500 USD.
Crude oil prices are still fluctuating strongly around 57.2 USD/barrel, creating an unstable foundation for the commodity market. The FED will announce its policy in the early morning of May 8. Although it is expected to not change interest rates, any statement can move the market. This will be the next big catalyst for gold.

$HIMS is HIMS! 80% Upside AheadNYSE:HIMS is HIMS! 80% Upside Ahead
Demolished earnings and I have this name at a fair value of $76 per share based on HIMS 2030 $6.5B Rev. Guidance.
Also, H5_L Indicator is about to cross bullish while the Wr% is rising and swinging from green to red!
Profit Targets:
- $50
- $60
- ATHs!
Before EOY!
Not financial Advice
