US30 Approaching Key Resistance–Potential Reversal Setup in Play🧠 Chart Overview
Asset: US30 (likely the Dow Jones Industrial Average)
Timeframe: Appears to be 1H or 2H
Indicators:
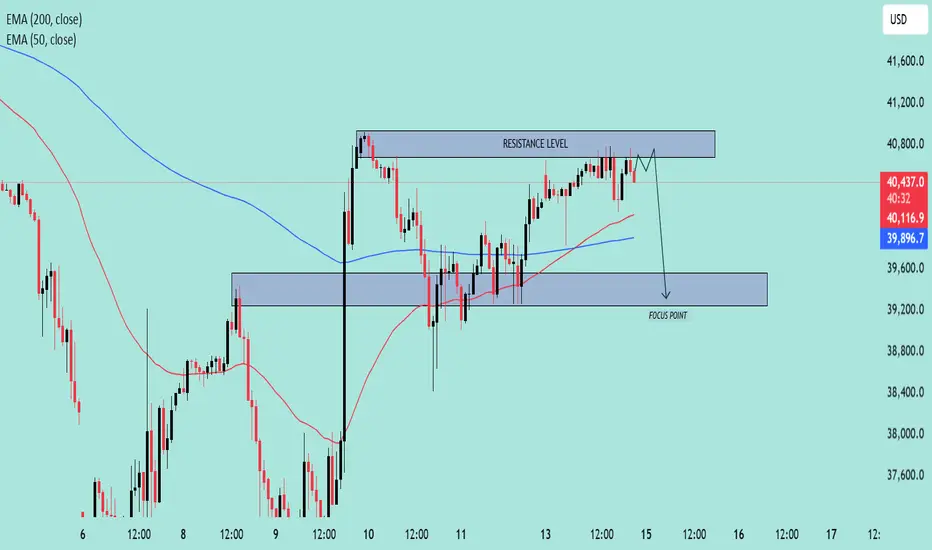
EMA 50 (Red): 40,119.5
EMA 200 (Blue): 39,897.3
Price at time of chart: Around 40,503
🔍 Key Technical Levels
🔴 Resistance Zone
Range: ~40,750 to 40,850
Price has tested this level multiple times and is currently hovering near it.
The resistance is holding, and no strong breakout has occurred.
🟦 Support / Focus Zone
Range: ~39,200 to 39,600
Marked as the “FOCUS POINT” – likely the expected target on a breakdown.
EMAs Insight:
Price is above both the 50 EMA and 200 EMA, suggesting short-term bullishness.
However, since it’s stalling at resistance, it could flip bearish on rejection.
🧭 Price Action Narrative
The chart suggests a potential fakeout above resistance, followed by a sharp rejection.
The path drawn shows a short-term dip, targeting the FOCUS POINT (support zone).
Rejection at resistance aligns with typical distribution behavior.
📌 Trade Idea (Bearish Bias)
Entry Idea: Short near or just above the resistance level (~40,800)
Target: 39,400 zone
Stop-Loss: Above the resistance level (~40,900+)
Risk/Reward: Favorable if price fails to break above resistance convincingly
📉 Bias: Bearish Reversal
Unless price breaks and closes above resistance with strong momentum, the chart favors a pullback scenario.
Chartview
XAU/USD 1H – Bullish Continuation from Demand Zone?📊 XAU/USD (Gold) 1H Analysis – Bullish Continuation Setup
🔹 Market Structure: Gold has been in a strong uptrend, with price currently consolidating near a key demand zone.
🔹 Key Levels:
🔴 Resistance: $3,050 - $3,060 (Potential target)
🟣 Demand Zone: $3,030 - $3,035 (Support area)
🟠 Deeper Support: $3,025 (Break below weakens bullish bias)
📈 Potential Trade Setup:
1️⃣ A possible pullback into the demand zone could attract buyers.
2️⃣ Price may wick below liquidity before reversing.
3️⃣ If support holds, we anticipate a move toward $3,050+.
✅ Entry Zone: $3,030 - $3,035
🎯 Target: $3,050 - $3,060
🚨 Stop Loss: Below $3,025
⚠️ Watch for price action confirmation before entering. A strong bullish candle from support could signal entry. Let the market show its hand! 🚀✨

XAU/USD Bullish Outlook: Wyckoff Accumulation & Breakout PotentXAU/USD (Gold) - 2H Chart Analysis 🏆📈
🔹 Wyckoff Structure Insight
The chart shows signs of a Wyckoff Accumulation phase.
UTAD (Upthrust After Distribution) at the previous highs suggests a liquidity grab.
Test of the resistance level before a strong rejection downward.
SOW (Sign of Weakness) was observed, but buyers regained control.
🔹 Key Technical Levels
Fair Value Range marked below, showing a potential area of demand.
Unfilled Imbalance (EMB unfilled) signals an area where price might revisit before continuing upward.
Gap below indicates a previous liquidity sweep before the bullish reversal.
🔹 Trend & Price Action
The 200 EMA (red line) is holding as dynamic support.
Current price action is showing higher lows and bullish structure development.
Projected bullish move 📈 is expected to test the $2,940+ region.
🔹 Trading Bias: Bullish ✅
A retracement to the EMA or minor pullback could offer re-entry opportunities.
Invalidation level: Below $2,900, where momentum could shift bearish.
🚀 Gold remains strong; watch for breakouts above $2,940!

Bitcoin (BTCUSD) Rejection – Bearish Move Incoming?📉 Key Observations:
Resistance Zone (Purple Box): Price has tested this area and faced rejection.
Bearish Projection (Gray Box & Arrow): The chart anticipates a drop towards the $76,800 - $77,000 range.
Liquidity Grab? Price might consolidate before a sharp decline.
⚠️ Possible Scenarios:
Rejection Confirmation 🔻: If BTC fails to reclaim $84,470, selling pressure could increase.
Breakout Fakeout? 🤔: A deviation above resistance followed by a dump remains a risk.
🎯 Levels to Watch:
Resistance: $84,470 - $85,078
Support: $80,000 and $76,825
🔥 Final Take: If BTC struggles below resistance, a short setup could play out. Confirmation is key!
