Aave trading above its important support * Aave in 1D time frame appears with Falling wedge pattern.
* Falling Wedge is a bullish pattern that appears when the price moves between two slightly downward sloping trendlines forming lower-lows and lower-highs.
* Aave is trading above its important support zone, if the bounces back breaking the falling wedge pattern we can expect a rally till $350.
* Price is bearish below the support zone.
Coinpedia

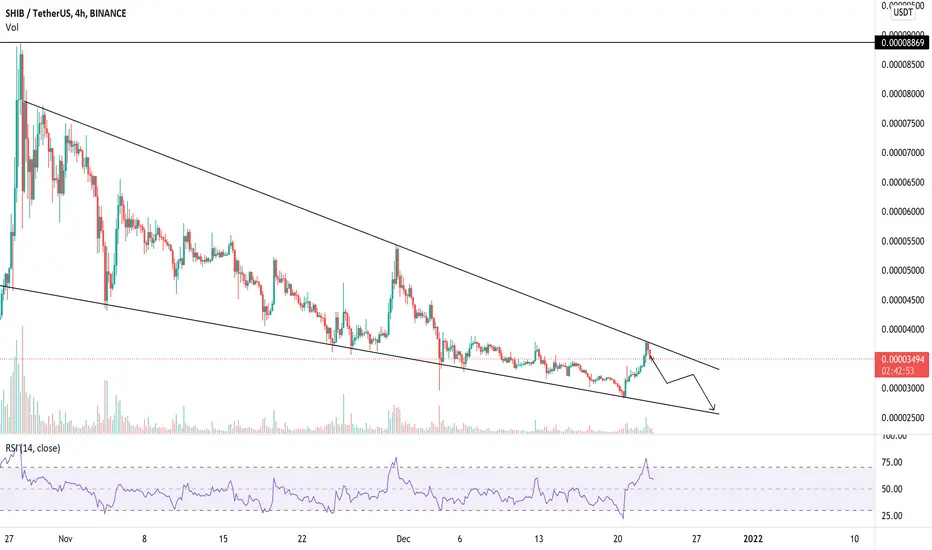
SHIBA rejecting from it's resistance 20% downfall expected ! * SHIB in 4H time frame forms a Descending channel pattern.
* Descending or Falling channel pattern appears when the price moves between two downward sloping parallel trendlines forming lower lows and lower highs.
* In this pattern SHIBA is rejecting from its resistance price may fall till the below support.