#DAX - 03 JanI was wrong in the direction yesterday. DAX did rally from opening to my target, it hit higher resistance before faltering. I said NDX had a strong resistance and it held completely.
Interestingly, DJIA held the selling and see the recovery in DAX towards the half way but NDX is weak. Price action is neutral to bearish and price opened within the BZ. I would say can play both sides today.
Market would need to retest the lows before any recovery IMO. So IMO, I will look at 16823 for a possible short to re-test 16677. 16645 is the next support for a possible long for a near term low. Overall, I am still neutral of the whole move (from bullish)
D-DAX

Dox and extension in the upward trend? How much correction??!Hello there,
I hope you're having a great start to the new year. I wish you all the best in your trading ventures and a happy new year with your loved ones.
I'm a fan of the Elliott wave principle, which I find interesting and useful for market analysis. I've developed my analytical approach by combining this principle with my personal experience and considering various scenarios that are likely to occur in the market.
Although I'm going to share my analysis with you, please note that I won't be providing a buy or sell signal. My goal is to share my unbiased analysis so that you can use it as a guide to make an informed decision.
To give you confidence in my analysis, I'll always share my previous analysis from the same market so that you can compare. All the details of my analysis are clearly labeled, making it easy for you to understand.
I hope my analysis will be useful to you in your business journey, and I wish you the best.
I'm waiting to hear from you. Finally, I'd like to remind you that like-mindedness and support, comments, and likes are the most important pillars of progress, like support points in the financial markets. They give me the energy to continue and share more ideas with you.
Sincerely,

DAX Elliott Wave Analysis for Wednesday 03/01/2024 (+ HTF)In the higher time frame, it looks like we started a new upward cycle from the October low. This means the wave ((2)) low is in after an expanded flat. The alternative scenario assumes a wave (2) low of a lower degree. In the lower time frame, we are observing ending upward structures. However, another high as a wave 5 cannot be excluded.

#DAX - 2 Jan I gave a short from 16803 on Friday to 16721 (). 16803 was traded, highs at 16811 before it tanked to 16723 and it rallied back to the highs.
The sell down was tied to the down move in US indices before the recovery. DAX was relatively strongly.
Overall, price action is bullish for monthly, weekly, daily IMO. Currently DAX gapped up and is testing above resistance. Despite the down move on Friday, overall price action is still bullish, trend is still up, thus looking for further upside. 16775, confluence of levels will be a good level to look for longs, targeting 16865 and 16905.

US30 LongsUS30 is breaking All-Time-Highs.
Trend is still Bullish.
Market opened with bullish momentum; waiting for retracement to enter long positions.
Aggressively enter new long positions once original position is in profit and has found support.
Avoid entering new positions if original position is negative.
Stop loss placed under bullish breakout.

SPX LongsMarket has been breaking All-Time-Highs.
Overall Market Trend is still bullish.
Same sized retracements (indicated by green trend-lines) have printed, along with a subsequent bullish breakout, confirm continuation of uptrend.
Invalidation at 4733.3 (stop loss placed)
No profit target (new highs cannot be accurately determined at this time).
Aggressively enter new positions once original position is in profit and has found support.
Avoid entering new positions if original position goes negative.
Look for similarities in US30, NAS100, FTSE, DAX & NIKKEI.

DAX Sell pattern, rejection on top.DAX has formed a Channel Down pattern following the December 14th rejection on the Rising Resistance.
The 1day MACD has formed a Bearish Cross like the one on November 28th 2022, which is a Top after a similar aggressive rally like the one the index ran since late October.
That top also turned into a Channel Down which then broke downwards and hit the 1day MA50, a little over the 0.382 Fibonacci level.
Sell now and target 16200 (little over the 1day MA50).
Previous chart:
Follow us, like the idea and leave a comment below!!

DAX: Bearish-SHARK detected.DAX: Bearish-SHARK detected.
Overbought market!
Monitor the PRZ
the EMA.50 and EMA.200 are potential targets.

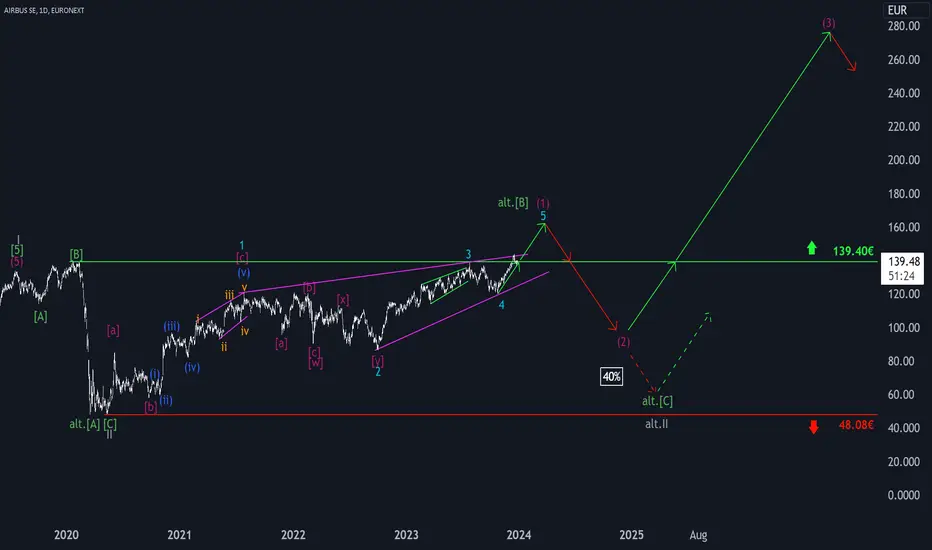
Airbus: Turbulence! 🌪️ 🛫Airbus shares continue to struggle at the resistance level of €139.40. In our primary assumption, the price should soon leave this level behind and complete the magenta-colored (1) with the top of the turquoise wave 5, before it goes down again significantly in the same color wave (2). If this downward journey is prolonged to the immediate vicinity of the support at €48.08, a new low of the gray old.II can be expected, shifted to the right. Primarily, however, we believe that the stock is already on the upswing of gray III, whose five-part magenta substructure should break out to its impulsive (3) after the low of (2) and set new all-time highs in the process.
DAX Elliott Wave Analysis for Wednesday 20/12/2023In the higher time frame, it looks like we started a new upward cycle from the October low. This means the wave ((2)) low is in after an expanded flat. The alternative scenario assumes a wave (2) low of a lower degree. In the lower time frame, we are observing ending upward structures.

A powerful impulse with a small correction pattern!Hello!
I am a big fan of the Elliott wave principle, which I find very interesting and useful for market analysis. I have developed my analytical approach by combining this principle with my personal experience and considering various scenarios that could occur in the market.
While I would like to share my analysis with you, please note that I am not providing a buy or sell signal. My primary intention is to share my unbiased analysis so that you can utilize it as a guide to make an informed decision.
To build your confidence in my analysis, I always share my previous analysis from the same market so that you can compare and see the progress. All the details of my analysis are clearly labeled, which should make it easy for you to understand.
I hope that my analysis is useful to you in your business journey, and I wish you all the best.
I am looking forward to hearing from you. Lastly, I would like to mention that like-mindedness and support, comments, and likes are the most important pillars of progress, just like support points in the financial markets. They give me the energy to continue and share more ideas with you.
Sincerely

DAX to breakdown at overbought extremes?GER40 - 24h expiry
Although the bulls are in control, the stalling positive momentum indicates a turnaround is possible.
Current prices have reacted from a low of 16662, however, we expect further losses to follow.
Price action resulted in a new all-time high at 17004.
An Evening Doji Star formation has been posted at the high.
A break of the recent low at 16662 should result in a further move lower.
Daily signals for sentiment are at overbought extremes.
We look to Sell a break of 16658 (stop at 16758)
Our profit targets will be 16418 and 16348
Resistance: 16793 / 16850 / 16950
Support: 16720 / 16662 / 16600
Risk Disclaimer
The trade ideas beyond this page are for informational purposes only and do not constitute investment advice or a solicitation to trade. This information is provided by Signal Centre, a third-party unaffiliated with OANDA, and is intended for general circulation only. OANDA does not guarantee the accuracy of this information and assumes no responsibilities for the information provided by the third party. The information does not take into account the specific investment objectives, financial situation, or particular needs of any particular person. You should take into account your specific investment objectives, financial situation, and particular needs before making a commitment to trade, including seeking advice from an independent financial adviser regarding the suitability of the investment, under a separate engagement, as you deem fit.
You accept that you assume all risks in independently viewing the contents and selecting a chosen strategy.
Where the research is distributed in Singapore to a person who is not an Accredited Investor, Expert Investor or an Institutional Investor, Oanda Asia Pacific Pte Ltd (“OAP“) accepts legal responsibility for the contents of the report to such persons only to the extent required by law. Singapore customers should contact OAP at 6579 8289 for matters arising from, or in connection with, the information/research distributed.

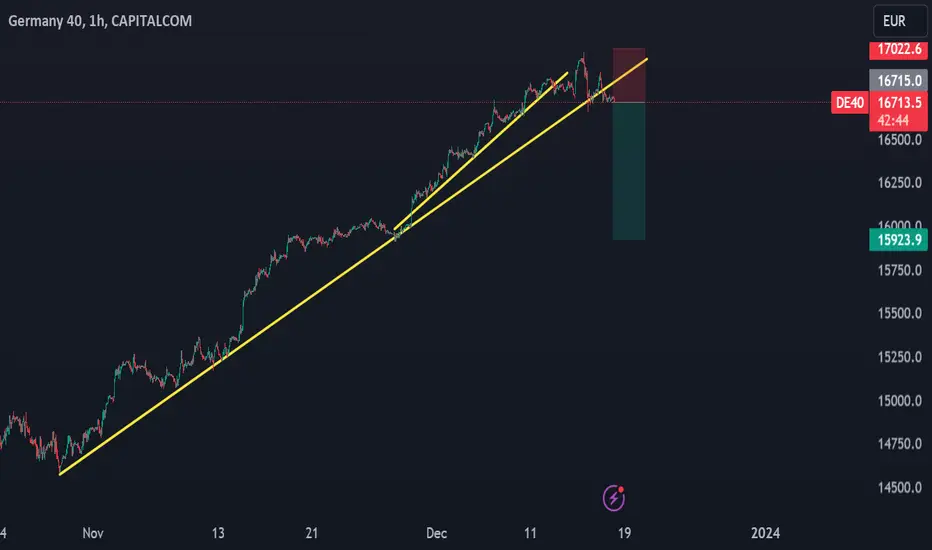
DAX Short setupDax looks so good for a short. I can clearly see a broke down of a weekly trendline on higher timeframe. On lower timeframe we can also see a break of a short-term trendline, short squeeze and drop. My indicators also shown a good divergence on h4 timeframe, and a drop is gihly expected
✅DAX BULLISH BREAKOUT|LONG🚀
✅DAX is trading in an
Uptrend and the index broke
The key horizontal level
Of 16,500 so I am bullish
Biased now and I think that
We will see a further move up
LONG🚀
✅Like and subscribe to never miss a new idea!✅

DAX Elliott Wave Analysis for Monday 18/12/2023 (+ HTF)In the higher time frame, it looks like we started a new upward cycle from the October low. This means the wave ((2)) low is in after an expanded flat. The alternative scenario assumes a wave (2) low of a lower degree. In the lower time frame, we are observing ending upward structures.

DAX: Channel Up keeps it bullish. Strong correction if it breaksDAX is trading inside a Channel Up pattern since October 27th and it has been intact for so long that the 1D timeframe remains overbought (RSI = 78.050, MACD = 373.200, ADX = 82.264). Since it is holding the 4H MA50 over the bottom of the Channel Up, we remain bullish aiming at a +4.66% rise (TP = 17,400), which is the lowest it has registered inside this pattern. If the price crosses under the Channel Up however, we will short aiming near the S1 level (TP = 16,000), which can test the 1D MA50.
## If you like our free content follow our profile to get more daily ideas. ##
## Comments and likes are greatly appreciated. ##

DAX Elliott Wave Analysis for Friday 15/12/2023In the higher time frame, it looks like we started a new upward cycle from the October low. This means the wave ((2)) low is in after an expanded flat. The alternative scenario assumes a wave (2) low of a lower degree. In the lower time frame, we are observing ending upward structures.

DAX about to start its final leg up?What do we got here since the 2022 low? Right PA holding above 4.236 with actually already having triggered final target around 8.236.
Recent PA could be seen as a broadening wedge - typical for a wave 4 corrective pattern.
---
If you like my content, if it helps you gain profit, give it a like!
Thanks!
---
Hold my beer pls
----
No financial advice, do your own research, don't be stupid

DAX Will the 1D Golden Cross pull it back like last time?DAX (DE40) is trading within a 16-month Channel Up and is currently on the second most aggressive bullish leg, about to form the 2nd 1D Golden Cross within that time span. The 1D RSI is above 85.00 touching historically overbought levels while the price is approaching the 1.382 Fibonacci extension from the previous Higher High of the Channel, which is below where the Channel's first bullish leg of October - November 2022 peaked and then, after a 1D Golden Cross formation, pulled back to its middle trend-line and the 1D MA50 (blue trend-line).
Despite those bearish indicators, we will sell only after the 1D MACD forms a Bearish Cross, which has been the most consistent sell signal throughout this period of time and target 16500 (Channel's middle). On the other hand, if the index breaks above the 1.382 Fib first, we will buy the break-out and target 18000, which is the top (Higher Highs trend-line) of the Channel Up and +24.20% rise from the bottom (similar to the November 2022 rally).
-------------------------------------------------------------------------------
** Please LIKE 👍, FOLLOW ✅, SHARE 🙌 and COMMENT ✍ if you enjoy this idea! Also share your ideas and charts in the comments section below! This is best way to keep it relevant, support us, keep the content here free and allow the idea to reach as many people as possible. **
-------------------------------------------------------------------------------
💸💸💸💸💸💸
👇 👇 👇 👇 👇 👇

DAX Elliott Wave Analysis for Wednesday 13/12/2023In the higher time frame, it looks like we started a new upward cycle from the October low. This means the wave ((2)) low is in after an expanded flat. The alternative scenario assumes a wave (2) low of a lower degree. In the lower time frame, we are observing ending upward structures.

DAX continues to break into new all time highs.GER40 - 24h expiry
Price action resulted in a new all-time high at 16823.
There is no indication that the rally is coming to an end.
Yesterday's Marabuzo is located at 16715.
Preferred trade is to buy on dips. Our outlook is bullish.
We look to Buy at 16715 (stop at 16615)
Our profit targets will be 16965 and 17025
Resistance: 16823 / 16900 / 17000
Support: 16767 / 16700 / 16650
Risk Disclaimer
The trade ideas beyond this page are for informational purposes only and do not constitute investment advice or a solicitation to trade. This information is provided by Signal Centre, a third-party unaffiliated with OANDA, and is intended for general circulation only. OANDA does not guarantee the accuracy of this information and assumes no responsibilities for the information provided by the third party. The information does not take into account the specific investment objectives, financial situation, or particular needs of any particular person. You should take into account your specific investment objectives, financial situation, and particular needs before making a commitment to trade, including seeking advice from an independent financial adviser regarding the suitability of the investment, under a separate engagement, as you deem fit.
You accept that you assume all risks in independently viewing the contents and selecting a chosen strategy.
Where the research is distributed in Singapore to a person who is not an Accredited Investor, Expert Investor or an Institutional Investor, Oanda Asia Pacific Pte Ltd (“OAP“) accepts legal responsibility for the contents of the report to such persons only to the extent required by law. Singapore customers should contact OAP at 6579 8289 for matters arising from, or in connection with, the information/research distributed.

A Traders’ Weekly Playbook: A week littered with landmines While we look ahead to the BoJ meeting (19 Dec) and keep a vigil on headlines from local press on potential policy tweaks, this week it's not hard to find tier-one catalysts and event risk for traders to navigate their exposures over. On the central bank side, we look for guidance from the Fed, the ECB, the BoE, Norges Bank and the SNB. For traders who focus on the higher beta LATAM FX - MXN and BRL - we get the Banxico and BCB meetings.
We see preliminary PMIs in the US, UK, and EU, with the UK and Aus reporting employment data. The US CPI print gets close attention and after Friday’s NFP report this could have big implications on the pricing of a March cut from the Fed - at this point, I am inclined to fade current rate cut expectations, as it still feels like June is a more likely starting point for policy easing. However, a below consensus CPI print would clearly strengthen the case for sooner easing.
US treasuries will again be influential in driving the USD and gold, and while the FOMC meeting and US CPI print will be a clear risk, so could the US Treasury Departments scheduled FWB:37B 10yr (12 Dec 05:00 AEDT) & $21b 30yr bond auctions. I am leaning long of USDs this week but would get greater confidence on a break of 104.31 in the DXY, and a further push towards 7.2400 in USDCNH. USDCHF looks to eye a move into 0.8900.
I am still biased long of US equity indices, with the NAS100 getting good attention as it looks to break the consolidation highs. EU equity is where the momentum traders have focused attention, with the GER40 having closed higher in 8 of the past 10 sessions and sitting at new highs. We see good participation in the rally, with 93% of stocks above the 50-day MA, 72% above their 200-day MA, and 50% at 4-week highs. Perhaps too hot to initiate longs, pullbacks are likely buying opportunities in a bullish trend.
Gold has modest downside risk and I look for 1980/70 to come into play, while SpotCrude upside has been confined by the 5-day EMA, so break here and we should see a quick move to $73.06.
Good luck to all.
The marquee event risks for the week ahead:
UK employment and wages report (12 Dec 18:00 AEDT) – UK wages are expected to increase 7.6% 3m/yoy, a slowdown from the 7.9% yoy pace seen in September. Even though wages are falling, the absolute level of wages still supports the case for the BoE to ease the bank rate in 2H24.
Australia employment report (14 Dec 11:30 AEDT) – the median estimate from economists is for 11k jobs created in November, and the U/E rate to tick up to 3.8%. On the week, I would look to fade rallies in AUDUSD into 0.6670. EURAUD shorts look compelling, although AUD longs would be keen to see a better tape in the CN50.
US CPI (13 Dec 00:30 AEDT) – the marquee event risk of the week - the market looks for headline CPI to come in at 0.0% mom / 3.1% yoy, and core CPI at 0.3% mom / 4% yoy. Post US nonfarm payrolls, the market has reduced some of the lofty easing expectations for 2024, with US swaps now pricing 111bp of cuts by Dec 2024. With the market broadly short of USDs, the pain trade is a hotter CPI print, where core CPI comes in above 0.35% mom, resulting in the odds of a March rate cut being pared right back. Risk bulls and USD shorts will want to see a core CPI print below 0.25%, which keeps a cut in March firmly on the table.
Brazil central bank meeting (14 Dec 08:30 AEDT) – The BCB is expected to cut the Selic rate by 50bp to 11.75%. The broad view is the BCB will now cut at every meeting until the policy rate is closer to 10%.
Swiss National Bank meeting (14 Dec 19:30 AEDT) – CHF swaps price a 20% chance of a 25bp cut at this meeting and 67bp by Dec 2024 (or just under three 25bp cuts). Biased towards USDCHF upside this week, with conviction increasing through 0.8828.
Norges Bank meeting (14 Dec 20:00 AEDT) – we see NOK swaps price a 28% chance of a 25bp hike at this meeting, which seems underpriced. A 25bp hike wouldn’t surprise at all, an outcome that could promote a solid rally in the NOK.
BoE meeting (14 Dec 23:00 AEDT) – In theory, this meeting should be a low-volatility affair - There is no chance of changing policy at this meeting, and the BoE should vote 7-2 in favour of no change. With 3 cuts priced by late 2024, there are modest upside risks for the GBP at this meeting.
FOMC meeting (14 Dec 06:00 AEDT) – The Fed will provide new economic projections here, although we shouldn’t see any big changes in their inflation, growth, or unemployment estimates. The focus will be on their projections for the fed funds rate (or the ‘dots’ plot) in 2024. On balance, we should see the median projection for the fed funds rate in 2024 being taken from 5.1% to 4.875%, implying a base case of two 25bp cut next year, although there are risks of a deeper change to 4.6%. With US swaps pricing the fed funds rate at 4.21% by Dec 2024, if the 2024 ‘dot’ is set at 4.875% it could result in USD short covering. The tone of the statement and Powell's presser could also promote USD volatility, where Jay Powell should make it clear they’re not currently talking about easing. Modest hawkish risks in this meeting.
China monthly growth data (15 Dec 13:00 AEDT) – the market will see data on industrial production, fixed asset investment and retail sales. The consensus is for a strong lift in activity, notably in the November retail sales report which is eyed at 12.5% (from 7.6%). China’s equity market continues to attract sellers, and we see no let-up in the bearish trend. We therefore watch to see if the data can stabilize the tape and attract better buyers.
US retail sales (15 Dec 00:30 AEDT) – the market looks for a decline of 0.1% mom, with the control group element rising 0.2%. The outcome could influence Q4 GDP nowcast models, which currently suggest the US is growing at 1.25%.
Banxico meeting (Mexico) (15 Dec 06:00 AEDT) – there is no chance of a cut at this meeting, but the MXN will be sensitive to guidance on the future path of easing. March seems a likely starting point for Banxico to start its cutting cycle. MXNJPY has seen increased interest and should be on the radar given the BoJ’s meeting next week.
ECB meeting ( 15 Dec 00:15 AEDT) – the market will see new economic projections from the ECB, with their core CPI estimates expected to drop a touch to 2.8% in 2024, and 2024 GDP at 0.8% (from 1%). Post ECB executive board member Isabel Schnabel’s comments last week on inflation, the door is wide open for a rate cut in April - so EUR traders will be looking at signs around a readiness to cut. We should hear more on the future of PEPP reinvestments and the acceleration of reducing the ECB’s balance sheet.
EU HCOB manufacturing and services PMI (15 Dec 20:00 AEDT) - the consensus is we see the EU manufacturing index coming in at 44.5 (from 44.2), and services at 49 (48.7). Further poor numbers are expected, but recent trends show EU economic data – while weak - has been largely coming in better-than-feared.
UK S&P global manufacturing and services PMI (15 Dec 20:30 AEDT) – the consensus is we see the UK manufacturing index come in at 47.5 (from 47.2), and services at 51.0 (50.9). The market should be more sensitive to the service print, so a read above 52.0 should promote a GBP rally. A read below 50.0 should see GBP under pressure.
US S&P global manufacturing and services PMI (16 Dec 01:45 AEDT) - the consensus is we see the manufacturing index come in at 49.3 (from 49.4), and services at 50.7 (50.8).

DAX Elliott Wave Analysis for Monday 11/12/2023 (+ HTF)In the higher time frame, it looks like we started a new upward cycle from the October low. This means the wave ((2)) low is in after an expanded flat. The alternative scenario assumes a wave (2) low of a lower degree. In the lower time frame, we are observing ending upward structures.
