APPLE Best buy opportunity of the last 6 years.Back in August 02 2024 (see chart below), we introduced this model on Apple Inc. (AAPL) that had high probabilities of success at predicting Cycle peaks:
We may have not hit $280 but $260 is close enough especially if you are a long-term investor that values buying low and selling high.
Now that the price has corrected by -35% and just hit the 1M MA50 (blue trend-line) for the first time in almost 10 years (since July 2016), it is time to revisit this macro-model once again.
As you can see, -35% corrections have been present on every Cycle since the January 2009 bottom of the Housing Crisis. The pattern that the stock follows is very specific and it starts with a prolonged correction, the Bear Cycle essentially, which is a lengthy correction phase, such as the 2008 Housing Crisis, the 2015/16 China slowdown and the 2022 Inflation Crisis.
Then a very structured uptrend phase starts in the form of a Channel Up that leads the market to its first peak, followed by a shorter, quicker correction phase that tests the 1M MA50 and rebounds. The rebound is the final bull phase of the Cycle, usually strong and sharp and leads to the eventual Cycle Top and then starts then new Bear Cycle (prolonged correction).
Right now the current 4-month correction is technically, based on this model, the new shorter correction. Being more than -35% in size, the last one larger than this was the previous short correction of the last Trade War in October 2018 - January 2019 (-38%).
The similarities don't stop here but extend to the 1M RSI as well, which just entered its 25-year mega Buy Zone that has been holding since December 2000 and the Dotcom Crash! In fact the last time Apple's 1M RSI was this low was in June 2013, which was the bottom of the 1st short correction on our chart.
This remarkable symmetry just shows how similar the current phase is with its previous ones and if the symmetry continues to hold, we should be expecting a strong recovery to start. Even if the price makes a slightly deeper low as -38% (like the January 2019 bottom), we may still expect the minimum rise that it had all those years shown on the chart, +145%, which translates to a potential $390 Target long-term.
It is in times like this, that patient long-term investors filter out the news noise, make their unbiased moves and maximize their profit.
-------------------------------------------------------------------------------
** Please LIKE 👍, FOLLOW ✅, SHARE 🙌 and COMMENT ✍ if you enjoy this idea! Also share your ideas and charts in the comments section below! This is best way to keep it relevant, support us, keep the content here free and allow the idea to reach as many people as possible. **
-------------------------------------------------------------------------------
💸💸💸💸💸💸
👇 👇 👇 👇 👇 👇
Electronictechnology

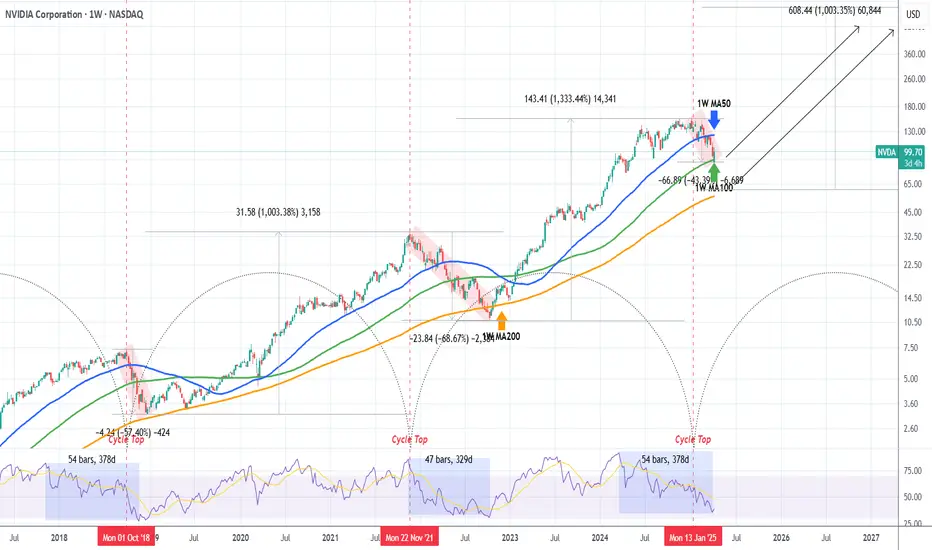
NVIDIA on Bear Market territory. Will the 1W MA100 save the day?NVIDIA Corporation (NVDA) has officially entered Bear Market territory as it has declined by almost -45% from the January 2025 All Time High (ATH) and just hit its 1W MA100 (green trend-line) for the first time since the week of January 30 2023.
This is the strongest correction the stock has seen since the 2022 Inflation Crisis and based on the Time Cycle Indicator of the last two Cycle Tops, the week of Jan 06 2025 falls indeed on the third count. This high degree of symmetry isn't only present on the price action but on the 1W RSI sequence itself as the current time range from the RSI High (March 18 2024) to today's Low is fairly consistent (54 weeks, 378 days) with the top-to-bottom range of the previous two Bear Markets, 2022 and 2018 (red Channel Down patterns).
So far the current correction looks similar to the September - December 2018 as not only their RSI counts are similar but both are more aggressive and fast than the 2022 Inflation Crisis. The 2018 correction though didn't top on the 1W MA100 but almost reached the 1W MA200 (orange trend-line) before making a bottom, but it did so in less than 2 months and declined by -57.40%. The current correction is already running for 3 months.
So what remains to be seen is if the 1W MA100 will manage to hold and kick-start a bullish reversal on its own, despite this correction being 'only' -43.39%. The 1W RSI dropped close enough to 30.00 (the oversold limit) though, which has historically been a very reliable indicator for a long-term buy on NVDA.
If those work in favor of the 1W MA100 holding, expect to see a strong rebound, that will confirm the new Bull Cycle with a break above the 1W MA50 (blue trend-line) and can technically aim for at least a +1000% rise from the bottom, as both previous Bull Cycles did.
If the 1W MA100 fails, we expect a bottom by the end of June 2025 around the 1W MA200 between $65-60. Again a +1000% rise from that level is technically plausible, potentially giving a Target estimate of at least $660.
-------------------------------------------------------------------------------
** Please LIKE 👍, FOLLOW ✅, SHARE 🙌 and COMMENT ✍ if you enjoy this idea! Also share your ideas and charts in the comments section below! This is best way to keep it relevant, support us, keep the content here free and allow the idea to reach as many people as possible. **
-------------------------------------------------------------------------------
💸💸💸💸💸💸
👇 👇 👇 👇 👇 👇
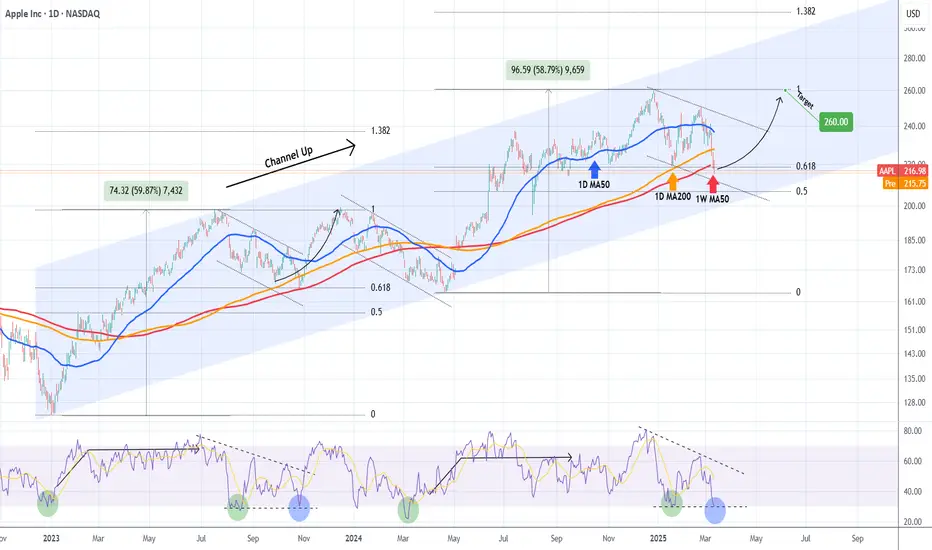
APPLE Buy opportunity on the 1W MA50.Apple Inc. (AAPL) has been trading within a 2-year Channel Up since the January 03 2023 bottom and in the past 3 months (December 26 2024) has been forming the latest Bearish Leg. On Tuesday this Leg broke below its 1W MA50 (red trend-line) for the first time in 10 months (since May 08 2024), which is the strongest buy signal since the April 19 2024 Higher Low bottom of the Channel Up.
As you can see, even the 1D RSI pattern is similar with the one that made the October 26 2023 1W MA50 test. That was also on the 0.618 Fibonacci retracement level from the respective previous Low.
As a result, it is now highly likely to see a rebound, especially if the 1W candle closes above the 1W MA50, to test the previous High and 1.0 Fib at $260, like the December 14 2023 High did.
-------------------------------------------------------------------------------
** Please LIKE 👍, FOLLOW ✅, SHARE 🙌 and COMMENT ✍ if you enjoy this idea! Also share your ideas and charts in the comments section below! This is best way to keep it relevant, support us, keep the content here free and allow the idea to reach as many people as possible. **
-------------------------------------------------------------------------------
💸💸💸💸💸💸
👇 👇 👇 👇 👇 👇
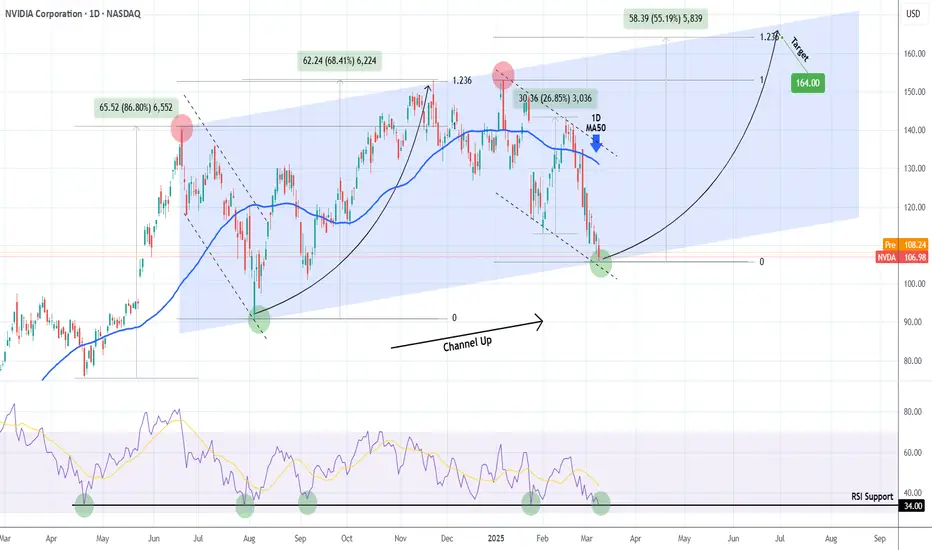
NVIDIA 9-month Channel Up bottomed! Is it a buy??NVIDIA Corporation (NVDA) has been trading within a Channel Up pattern for almost 9 months (since the June 20 2024 High). The correction since the start of January is technically the pattern's Bearish Leg and yesterday it hit the bottom (Higher Low trend-line).
Last time it did so was on August 05 2024 and an instant rebound followed. That was also the time the 1D RSI was on the 34.00 Support, just like today. In fact every time in the past 11 months that this RSI Support was tested, the price rebounded aggressively by at least +26.85%.
Since the previous Higher High rebound peaked on the 1.236 Fibonacci extension, our Target on the medium-term will be $164.00.
-------------------------------------------------------------------------------
** Please LIKE 👍, FOLLOW ✅, SHARE 🙌 and COMMENT ✍ if you enjoy this idea! Also share your ideas and charts in the comments section below! This is best way to keep it relevant, support us, keep the content here free and allow the idea to reach as many people as possible. **
-------------------------------------------------------------------------------
💸💸💸💸💸💸
👇 👇 👇 👇 👇 👇
AMD Channel Down bottomed on RSI Bullish Divergence.Advanced Micro Devices (AMD) have been trading within a Channel Down pattern since the March 08 2024 All Time High (ATH). The pattern is currently on its 3rd Bullish Leg and is below its 1D MA50 (blue trend-line) for exactly the past 3 months.
This Bearish Leg has however most likely come to an end as the 1D RSI is on Higher Lows against the price's Lower Lows, showcasing a Bullish Divergence similar to May 01 2024. As a result, we can expect the new Bullish Leg to start, with the previous minimum being +32.85%. Target $148.00.
-------------------------------------------------------------------------------
** Please LIKE 👍, FOLLOW ✅, SHARE 🙌 and COMMENT ✍ if you enjoy this idea! Also share your ideas and charts in the comments section below! This is best way to keep it relevant, support us, keep the content here free and allow the idea to reach as many people as possible. **
-------------------------------------------------------------------------------
💸💸💸💸💸💸
👇 👇 👇 👇 👇 👇

NVIDIA hit its 1W MA50 after 2 years! One last rally left?NVIDIA Corporation (NVDA) opened significantly lower on Monday following the DeepSeek news on more efficient and lower cost A.I. competition and by doing so, the price hit its 1W MA50 (blue trend-line) for the first time in 2 years, resulting in Tuesday's very strong rebound.
We have to go back to the week of January 23 2023 to see NVDA trading again on the 1W MA50, which became the major Support of the Channel Up pattern that took it off the 2022 Inflation Crisis bottom.
So the question is, does NVIDIA have fuel left in the tank for one more rally? Technically the answer is yes and it can be found on the stock's price action since July 2015. As you can see, the price has gone through 3 similar eras of Bull Cycles through Channel Up patterns and subsequent Bear Cycles of strong corrections that touched the 1W MA200 (orange trend-line) before initiating the new Bull.
From the Bear Cycle bottom to the Bull Cycle's top, NVIDIA took around 1100 days (1162 during the 2015 - 2018 Cycle and 1071 during the 2019 - 2021 Cycle). Assuming the current Cycle will be at least as long as the last one (1071 days), the stock's Top is expected to be around September 2015.
It was in fact around this time during the last Cycle (Feb 2021) when NVIDIA touched again its 1W MA50, resulting into a new rally phase, the last one of the Cycle. This historic price action shows that during its last year, the stock always makes a January - Oct/Nov rally. When the 1W MA50 gets hit again, it is when the new Bear Cycle is confirmed.
As a result, based on this data set, we've entered NVIDIA's final rally of the Cycle, assuming of course it doesn't close a candle below the 1W MA50 and also that the 1M RSI recovers its MA trend-line (yellow), which also happened again during its previous Cycle.
-------------------------------------------------------------------------------
** Please LIKE 👍, FOLLOW ✅, SHARE 🙌 and COMMENT ✍ if you enjoy this idea! Also share your ideas and charts in the comments section below! This is best way to keep it relevant, support us, keep the content here free and allow the idea to reach as many people as possible. **
-------------------------------------------------------------------------------
💸💸💸💸💸💸
👇 👇 👇 👇 👇 👇

BROADCOM made a Top on the 2year Channel. Potential danger aheadExactly 1 month ago (November 18, see chart below) we gave the buy signal on Broadcom Inc. (AVGO), which turned out to be a big success as shortly after the stock catapulted past our $223 Target:
This time however we share with you an analysis that is calling for profit taking on this amazing rally as technically it is coming to an end. The price hit yesterday the top (Higher Highs trend-line) of the 2-year Channel Up, which has approached another 3 times during that time.
As you can see, the pattern's structured Legs and Phases are cyclical and repeat themselves. The current Top seems to be similar to the previous Highs (orange circles) that initiated the re-accumulation phases before resuming the uptrend for the final top (red circles) of the Bullish Leg.
Both of those pre-Top Highs (orange circles) and their re-accumulation phases that followed, touched the 1D MA200 (orange trend-line) before the final rally of the Bullish Leg. As a result, we won't turn bullish again on AVGO until it tests the 1D MA200 again, which given the aggression of the recent pump, the pull-back could be equally strong.
After the re-accumulation Phase is completed, we will resume our long-term bullish Target of $285.00. That represents a +121.85% rise from the August 05 2024 Low, which is the % rise that both previous Bullish Legs had.
-------------------------------------------------------------------------------
** Please LIKE 👍, FOLLOW ✅, SHARE 🙌 and COMMENT ✍ if you enjoy this idea! Also share your ideas and charts in the comments section below! This is best way to keep it relevant, support us, keep the content here free and allow the idea to reach as many people as possible. **
-------------------------------------------------------------------------------
💸💸💸💸💸💸
👇 👇 👇 👇 👇 👇

NVDIA Why buying in December is an excellent strategy.NVIDIA corporation (NVDA) has entered the 2nd half of December below its 1D MA50 (blue trend-line). On any other occasion that would've been alarming, for NVDIA however this presents the best long-term buy opportunity in a while.
The reason is simple and has to do with the amazing symmetry that the 2-year Channel Up (which NVDIA has been trading in) displays. Despite breaking below the 1D MA50, the price is still contained within the Channel Up, in fact it is very close to making direct contact with its Higher Lows trend-line. That would be a technical bottom, with the last Support marginally lower on the 1D MA200 (orange trend-line).
On this pattern, we can see that the stock's price action is highly systemic and can be classified into the: a) Accumulation Phase (Rectangle) where the market engages into long-term long positioning again after the Channel Up tops (forms a Higher Highs) and b) the Bull Phase (green Channel Up) where the price enters the aggressive rally of the long-term Channel's Bullish Leg.
As you can see, the previous two Bullish Legs have risen by roughly +257.68%, one from the bottom of the Accumulation Phase (Leg 2) and the other from its December bottom (Leg 1). It is also quite evident on this chart that the month of December plays a critical significance for NDVIA. On December 2022 and December 2023 the true rally sequences of the Bullish Legs started.
As a result, we can expect this sideways, neutral price action that the company has been having lately to bottom by the end of December (2024) and initiate the hyper aggressive part of the new Bullish Leg (green Channel Up). Also, even if it repeats the less aggressive pattern of Leg 2 and rises by +257.68% from the Accumulation Phase's bottom, we can expect to see it rise by as high as $320 by this Summer.
-------------------------------------------------------------------------------
** Please LIKE 👍, FOLLOW ✅, SHARE 🙌 and COMMENT ✍ if you enjoy this idea! Also share your ideas and charts in the comments section below! This is best way to keep it relevant, support us, keep the content here free and allow the idea to reach as many people as possible. **
-------------------------------------------------------------------------------
💸💸💸💸💸💸
👇 👇 👇 👇 👇 👇

APPLE targeting $265 at the top of the Channel UpApple (AAPL) has been trading within a Channel Up pattern since the January 03 2023 bottom. At the moment the price is on the pattern's second long-term Bullish Leg, supported by the 1D MA50 (blue trend-line).
As long as this line holds, we expect the Bullish Leg to complete a +20.82% rise (similar to December 14 2023) from the U.S. elections low and target $265.00. The fractals are quite similar as the 1W MACD is forming now a Bullish Cross, in indentical fashion as November 20 2023.
-------------------------------------------------------------------------------
** Please LIKE 👍, FOLLOW ✅, SHARE 🙌 and COMMENT ✍ if you enjoy this idea! Also share your ideas and charts in the comments section below! This is best way to keep it relevant, support us, keep the content here free and allow the idea to reach as many people as possible. **
-------------------------------------------------------------------------------
💸💸💸💸💸💸
👇 👇 👇 👇 👇 👇

SMCI is -85% a buy opportunity while accounting issues continue?Super Micro Computer Inc (SMCI) still haven't found a new Auditing Firm, after it was announced last week that Ernst & Young left them raising governance and management communication issues. Yesterday's Low represents almost a -85% drop from the March $122.50 All Time High (ATH). So is this level a bargain and a buy opportunity for long-term investors?
Well while the company hasn't filed the necessary paperwork to meet the regulatory requirements to remain listed on the stock market and no auditor is hired to confirm and signs their reports, investor confidence will remain low (to say the least). It appears that SMCI has turned into the new short favorite for Hedge Funds and that's never ideal.
Technically though, the stock hit yesterday its 1W MA200 (orange trend-line) for the first time in 4 years (since October 26 2020)! With that contact, the price initiated a strong multi-week rally that made a new High. This is a textbook buy for long-term investors. Of course it is all about risk and money management and since regulatory risks remain, the capital invested best to be less than usual.
Another technical factor supporting a buy on these levels is the 1W RSI, which got oversold (<30.00) for the first time since the weeks of March 16 2020 (almost 31.50) and October 01 2018 (U.S. - China trade wars). Both these times, SMCI kick-started enormous rallies.
The October 01 2018 bottom in particular is the starting date of the Fibonacci Channel Up on this chart, which encompasses SMCI's logarithmic growth these past years. As a result the company has only experienced 3 major long-term buy opportunities with the most recent 4 years ago.
At the same time, yesterday's Low didn't only make contact with Fibonacci 1.0 of the Channel Up (i.e. the initial top until the price turned parabolic and broke-out) but also almost touched the 0.382 horizontal Fib level, starting all the way from October 2018.
It is obvious that purely from a technical perspective such levels are as good as a buy can get. Proper risk management and an exit strategy are needed (in case of delisting) and long-term investors can be patient and take their time to target the $122.50 High again for enormous gains (could take even 1 year).
-------------------------------------------------------------------------------
** Please LIKE 👍, FOLLOW ✅, SHARE 🙌 and COMMENT ✍ if you enjoy this idea! Also share your ideas and charts in the comments section below! This is best way to keep it relevant, support us, keep the content here free and allow the idea to reach as many people as possible. **
-------------------------------------------------------------------------------
💸💸💸💸💸💸
👇 👇 👇 👇 👇 👇

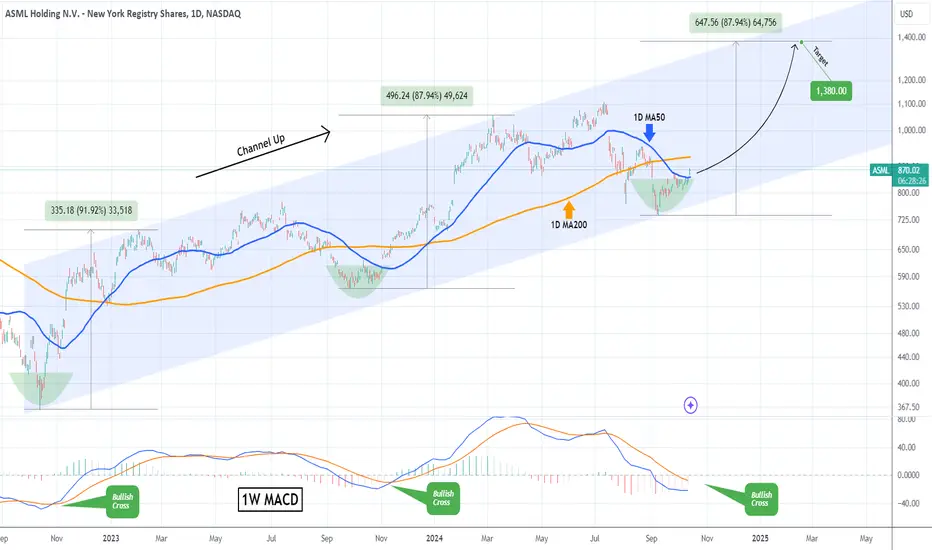
ASML Perhaps the most structured buy in the market!ASML Holding (ASML) has been trading within a 2-year Channel Up pattern since the October 13 2022 Low. The recent September 10 2024 Low has been at the bottom of the pattern, technically forming its new Higher Low.
Yesterday it broke and closed above its 1D MA50 (blue trend-line) for the first time in 3 months, which has been a solid bullish break-out signal on both previous Bullish Legs. Those then went on huge rallies that rose by +87.94% and +91.92% respectively.
As a result, with the 1W MACD about to form the final buy confirmation with a Bullish Cross, we set a 1380 long-term Target on a minimum +87.94% rise from the bottom, that will form an ideal Higher High on the Channel Up.
-------------------------------------------------------------------------------
** Please LIKE 👍, FOLLOW ✅, SHARE 🙌 and COMMENT ✍ if you enjoy this idea! Also share your ideas and charts in the comments section below! This is best way to keep it relevant, support us, keep the content here free and allow the idea to reach as many people as possible. **
-------------------------------------------------------------------------------
💸💸💸💸💸💸
👇 👇 👇 👇 👇 👇
CISCO Strong price jump. Still high upside potential.Cisco Systems (CSCO) opened today considerably higher leaving behind both the 1D MA200 (orange trend-line) and 1D MA50 (blue trend-line) which was its Resistance this week. The price even broke above the 0.5 Fibonacci retracement level for the first time since May 04 2022. Needless to say this is a major bullish break-out from all perspectives.
We expect a pull-back only after the 1D RSI hits 74.00, which has been the overbought level that caused major corrections. Up until that overbought level, the stock rose every time (3 occasions) by a minimum of +22.50% (others +26% and +30%). Assuming we see another (minimum) +22.50% rise before an overbought 1D RSI rejects the uptrend, we can expect a new High around $56.80, which is exactly at the bottom of a Resistance Zone holding since February 18 2022 (almost a year!) where 4 rejections took place a little after the peak of the market.
Notice that a 1D Death Cross on March 21 2022 was what really made the price collapse aggressively during the Bear Market and a 1D Golden Cross (December 28 2022) is what can potentially make it recover the full distance to the prior market High.
-------------------------------------------------------------------------------
** Please LIKE 👍, FOLLOW ✅, SHARE 🙌 and COMMENT ✍ if you enjoy this idea! Also share your ideas and charts in the comments section below! **
-------------------------------------------------------------------------------
💸💸💸💸💸💸
👇 👇 👇 👇 👇 👇
