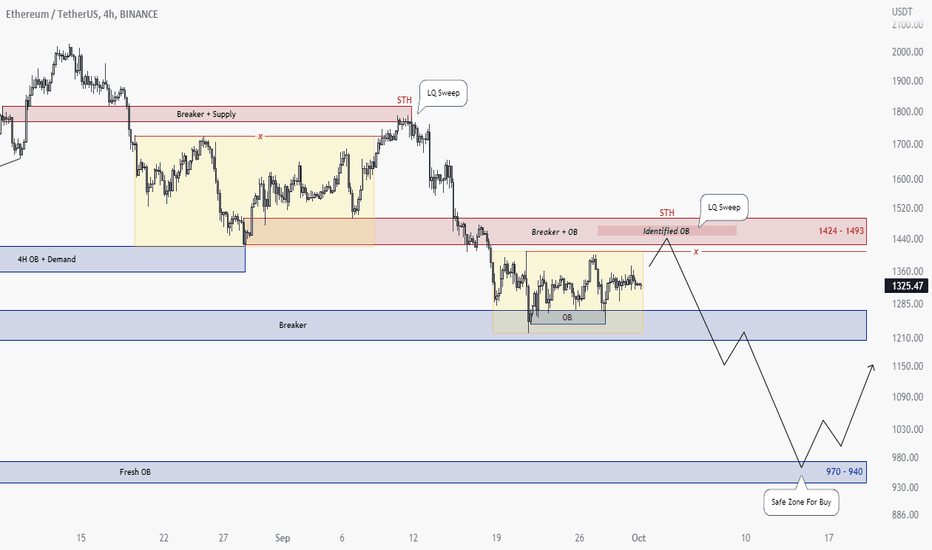
Predictions and analysis
🟡 BTCusdt ⏰ Daily 📅 Oct / 03 / 2022 ⚪ I have shown Close resistance and support with orange and green box. 🔴 Resistances : 19800 $ 20385 $ 20706 $ 21888 $ 22488 $ 22799 $ 🟢 Supports are in the chart ---------------------------------- 📛 Follow the market trend and decide to buy or sell. ⚠️ (This isn't a signal for buy or sell)...
That's my first published Analysis, so sorry if it looks a bit messy. So guys keep an eye on ETH Cause Opportunity is coming for Long - Short positions.
Hi folks, I hope you're doing good. I'm eyeing an intraday swing long. It fits my model. Let play this. I'm already in giga long ETH. lets nail this together. Key is risk control.
7/ $ETH not much on daily #ETH 4hr = symmetrical🔺, tends 2b continuation patterns, not crazy seeing that now 4Hr $BTC looks better, same pattern though Weekly #BTC is concerning, needs to reverse asap This line has held well but the more it's tested, the weaker it gets. If #stocks rally, #crypto should as well #Ethereum #Bitcoin
Based on technical factors there is a Long position in : 📊 ETHUSDT Ethereum 🔵 Long Now 1303.00 🧯 Stop loss 1230.00 🏹 Target 1 1388.00 🏹 Target 2 1475.00 🏹 Target 3 1555.00 💸Capital : 1% We hope it is profitable for you ❤️ Please support our activity with your likes👍 and comments📝
-Welcome to Monday October 3rd The Q3 close last Friday showed a complete route in the general markets as the quarterly close saw the DOW, NQ, and SP down 16%, 17%, and 20% from their summer rally highs. The Dollar Currency Index is still fully parabolic from it’s double bottom from May 2021. The collapsing value of the Swiss Bank Credit Suisse has brought to...
I'm all eyes to see another stop hunt soon from banks and market makers to catch the liquidity. This liquidity plays as a fuel role for more downtrend move. It was just for precaution !!! The history is being repeated...
Luna Classic is still in its corrective/consolidation phase. The bounce was just a hype bounce, with new lows coming. As you can see a very similar type of bounce happened with LUNA in the first run but then was followed by a slow downward bleed with wicks much lower along the way before the next run up. My downside targets have not changed. I still see...
After being in a bearmarket for a long time, bitcoin is tending to breakout of the downtrend. Reasons: - Bullish divergence on weekly and daily! - RSI soon breaking downtrend - Macd same log as 2015 and 2018 bottom. - Macd cross up weekly! October going to be insanely bullish! Also historically has october been a very bullish month!
Ethereum - 22h expiry - We look to Sell at 1349 (stop at 1381) Bespoke resistance is located at 1350. We look for a temporary move higher. Preferred trade is to sell into rallies. Daily signals are bearish. Our profit targets will be 1271 and 1231 Resistance: 1300 / 1350 / 1400 Support: 1270 / 1250 / 1220 Disclaimer – Saxo Bank Group. Please be reminded...
Hi friends! September closed with a loss of -3% for BTC. As 7 out of 9 September were "red" for crypto, it was expected that the 10th September would close in negative zone. Finally, we have reached October, which has already been nicknamed UPTOBER . Wonder why? Read to the end! 🔥UPTOBER IS HERE🔥 Friends, take a look on this stats. 7 out of 9 Octobers were...
Hello Community, Welcome to this analysis about Ethereum on the 4-hour timeframe perspective. As when looking at my chart Ethereum is building this primary channel formation in which it penetrates the upper and lower boundaries with volatility bounces, such movements are indicating that a final breakout will lead to even higher volatility once the shifting...
In my opinion, we are in a diametric on the 1 hour time frame that we can move down after the completion of the G wave.
ETH seems to have found it's range lows again - Loss of this level and we have bigger issues in all markets, so if you are feeling bullish, this is the long zone
ETHUSD Weekly Forecast Analysis 3-7 Oct 2022 We can see that currently the volatility is around 10.02% for this week, decrising from the 14.11% from the last week. Currently there is around 27.3% that the asset is going to close either above or below the channel: TOP 1457 BOT 1096 The current volatility percentile is around 70th, and in this situations in...
H&S in play, broke the trendline, previous lows this year was ~$800... BTC Looks to be testing $17k area, so...
▫️Bitcoin on the futures chart, an ascending channel formation. ▫️Over the weekend, as expected, no sharp movements were observed, the exit from the channel followed before the opening of the daily candle (Monday), at the moment the struggle is again for $ 19.000 I think that the opening of the SPX500 will give direction to the market and it will most likely be...
A chart for ETHUSD Showing the apparent W structures in green rectangles The current structure is yet to form the right arm of the W The price expectation and the right arm is shown with the yellow bars pattern Any day now...


