Short drawback tomorrow, then bull run for a few daysNNA has solid fundamentals, but obviously that's not enough these days to mean much in short term trading.
Dailys are showing solid bull set up with the indicators. Hourly indicators are a bit mixed.
Daily Fib-arc, Bullish Gartley, pitchfork, and pitchfan are showing gradual-immediate bull. I'm in, are you?
Fibonacci Arcs
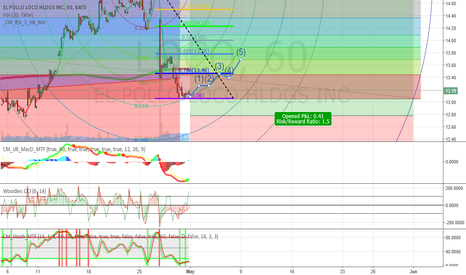
Loco long next monthI'm seeing a set up for a bull run.
Trend lines have been upward slanted the last few months and is still be tested (currently we are on/around the median).
Fibonacci resistance/support lines are being tested too.
I'm thinking either in pre-hours, or early hours after opening the price very well might fall due to exterior motives (SPY tanking); but I don't think it will go below the previous support of 12.80. If it does, it will bounce on it back into a bull Price Action.
EVHC bear cave next few daysAgain, most indicators are leading to a correction; I'm going short.
With the recently tested 23.66 resistance, plus the blue downward-slopping warning line from the pitchfork, I'm guessing the price action in the next few days won't go above the 23.66 price point.
The hourly and daily lower indicators (macd, rsi, cci, slow stoch) are all showing a possible correction in the near future. I'm guessing till the start of May.
I'm noting the first reaction line is around that end time point, so it might reverse soon thereafter.
5 day long on MHLDStrong conformance to long-term Andrew's pitchfork. Lower screen indicators are not peaking, with the macd below zero; cci looks like its moving up towards 100; all signs of some bull movement.
Have a strongly confirmed trend-based fib extension, fib retracement, and fib arc.
Signs that this isn't longer-term bull market: (besides global news and markets) price is still below Andrews pitchfork median, the sma200 (which is closer to the upper mid-parallel, in blue), most of the ema's are still above the priceaction. Therefore this might change direction within the week.
NNA bull and shortDaily indicators are showing strong bearish signs.
Hourly and minute indicators are showing the opposite. I'm therefore assuming a bull will be loose for the next two days (maybe three), then it will break for the median and lower support levels.
SKX Upwards to 30.75 next 35 daysSynopsis:
RSI, Stoch, MACD all point to up trend. (Strong signal)
Fibonacci confirms strong levels of support (26.70) and Resistance
Pitchfork showing downward and sideways trend, with price on the median.
Fib arcs show upcoming resistance zones (counting one we just entered)
I labeled the action reaction lines to help better understand what I was and am measuring to.
Expectations (Long):
4/11: Upwards following 1.618 underarc. some resistance at 0.236 arc
4/12: minor sideways and down movement along 0.236 arc, moving towards pitchfork median
4/13-14: moves up to 0.382 arc
4/15: Moves up towards 0.786 fib resistance line, .5 fib arc intersept
4/18: moves upwards to Reaction Line 2:1, Fib spiral, and .618 fib resistance level.
4/19-21: retraces to 0.786 fib support
4/22+: Upwards past 0.5 fib resistance, back towards Reaction Line 2:1 resistance
My dataminer is stating bull, but i'm only seeing bear (next 3 dMy data miner is showing high probability, based on last 20 years, of VOD going up
Longterm neutral Andrew's Pitchfork at roughly 33.50;
Shortterm schiff's pitchfork bullish (and below price action);
Showing strong support/resistance at fibonacci levels
ActionReaction showing a downtrend yet realized that should end around 4/22.
Fib Arcs showing strength by trends; both showing downward arc resistance.
All Bear news on MACD, Stoch, and CCI.
Let me know your thoughts


