Gold (XAUUSD) Trade Setup: Bullish Breakout Toward $3,637 TargeCurrent Price: $3,309.18
EMA 30 (Red Line): $3,265.00
EMA 200 (Blue Line): $3,163.35
Trend Direction: Strong uptrend (price above both EMAs)
Timeframe: 1-hour (short-term analysis)
📍 Key Levels
Entry Point: Around $3,266.63 (just above EMA 30)
Stop Loss: Around $3,265.00
Target (EA Target Point): $3,637.23
Potential Profit: +$365.01 or +11.16%
🔍 Technical Patterns & Zones
Rising Channel: Price is moving within a rising wedge or channel, indicating bullish momentum but with narrowing range — a potential reversal signal if broken.
Support Zone: Highlighted purple box around the entry point; likely a demand zone.
Resistance Zone: $3,637.23 area marked as the EA Target Point — previous resistance or Fibonacci extension level.
✅ Bullish Signals
Price is consistently making higher highs and higher lows.
EMAs are aligned in a bullish formation (short EMA above long EMA).
Clear breakout above consolidation range recently.
Trade setup shows favorable risk-to-reward ratio.
⚠️ Risks / Caution
Rising wedge can sometimes break down — watch for volume drop or divergence.
Potential pullback to the entry zone is expected (indicated by the arrow).
News Events: Symbols below the chart indicate upcoming USD economic data, which could bring volatility.
📈 Strategy Summary
Buy on pullback to $3,266.63 with tight stop at $3,265.00.
Target: $3,637.23 — potential 11% gain.
Risk: Minimal if stop is respected, tight stop-loss.
Fouyou

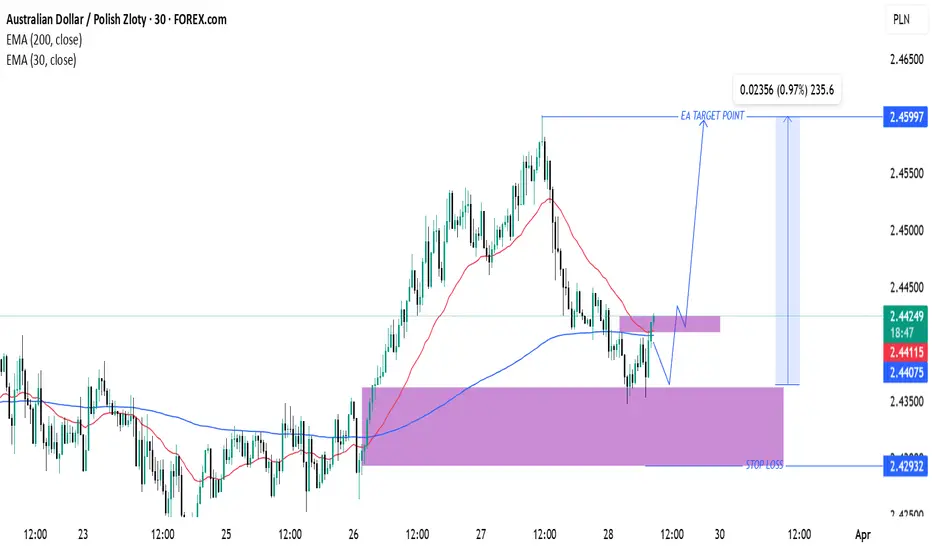
AUD/PLN Trade Setup: Bullish Reversal & Target ProjectionAUD/PLN Technical Analysis & Trade Setup
Chart Overview:
Currency Pair: Australian Dollar (AUD) / Polish Zloty (PLN)
Timeframe: 30-minute chart
Indicators:
200 EMA (Blue): 2.44075
30 EMA (Red): 2.44113
Key Levels & Strategy:
Support & Resistance:
Major Support Zone: Around 2.42932 (Stop Loss Area)
Intermediate Resistance: Near 2.44228
Target Resistance (Take Profit): 2.45997
Trade Projection:
The price recently bounced off the support zone (purple).
A possible retracement and retest of resistance before a strong upward move.
Targeting 0.97% profit potential from 2.44228 to 2.45997.
Entry Strategy:
Confirmation of support hold at 2.44075 - 2.44228.
If price respects this zone, a bullish continuation is expected.
If support fails, price may revisit the stop-loss area (2.42932).
Conclusion:
If price sustains above 2.44113, a bullish move is expected.
Watch for a breakout above resistance for a confirmed long entry.
A drop below 2.42932 would invalidate the setup.
USD/JPY Trade Setup & Analysis – Bullish Reversal from 200 EMAThe 200 EMA (blue line) at 149.701 acts as a strong support level.
The 30 EMA (red line) at 150.458 represents a short-term trend guide.
Trade Setup:
Entry Point: Around 150.120 (near the 200 EMA).
Stop Loss: Below 149.496, protecting against downside risk.
Take Profit Levels:
TP1: 150.287
TP2: 150.533
TP3: 150.886
Final Target: 151.377
Strategy:
Buy Position: The expectation is for the price to bounce from the 200 EMA and move upwards toward the targets.
Risk-Reward: Favorable, as the trade has multiple profit-taking levels.

EUR/USD Short Trade Setup – Key Resistance Rejection & Bearish TEntry Zone:
The entry for the short trade is around 1.08405 - 1.08412.
The price is expected to rise into this area before reversing downward.
Stop Loss:
Positioned at 1.08760 - 1.08770, above the resistance zone marked in purple.
This ensures the trade is invalidated if price moves too high.
Take Profit Levels (TP):
TP1: 1.07987
TP2: 1.07620
TP3: 1.07107
Final Target: 1.06604
Indicators Used:
200 EMA (Blue Line): At 1.08405, acting as resistance.
30 EMA (Red Line): At 1.08086, showing short-term trend direction.
Overall Trade Idea:
Price is expected to reject the 1.08412 resistance zone and move downward.
If the price respects the resistance, a strong bearish move toward the 1.06604 target is anticipated.
Potential Trade Plan:
Sell at: ~1.08405
Stop Loss: ~1.08760
Take Profit: Staggered at TP1, TP2, TP3, or full exit at 1.06604.
