USDSGD - Text Book Reversal!USDSGD has recent topped with a beautiful rejection! We had the 50 fibonacci, channel AND an ending diagonal, all indicating a reversal!
Now that we've topped, we can look for any pullbacks to add a position for the massive drop.
Trade idea:
- Watch for pullback
- once pullback appears, look for a trendline break or structure rejection
- Enter with stops above the highs (above 50 fib)
- Targets: 1.305 (700pips), 1.27 (1000pips)
Goodluck and as always, trade safe!
Gold-reversal

AUDUSD - Last Bearish Leg! AUDUSD has given us 3 incredible setups in the last few months.
Our first trade setup was after we broke the ascending trendline. We waited for a pullback and jumped in. Currently sitting at around 450pips. We also entered twice more on the clean corrections AUDUSD made.
We are now anticipating one final leg down before expecting a reversal.
Trade Idea:
- Watch for subwave 4 correction
- Enter on break of subwave 4 correction with stops above the correction
- Manually taper off positions as we move down
The longer term trade idea would be the reversal. Once we see the 5th wave down, we can monitor it closely for a reversal. One of the ways we can do that is by draw a descending trendline and wait for a breakout, indicating that bulls have stepped in.
Goodluck and as always, trade safe!
See below for our VIP setups.
AUDUSD Trade 1:
AUDUSD Trade 2:
AUDUSD Trade 3:

Gold - Take A Break? 🥇Hello TradingView Family / Fellow Traders. This is Richard, also known as theSignalyst.
After rejecting our 1800 support zone , Gold has been bullish making higher highs and higher lows.
However, it is approaching the upper brown trendline that I consider an overbought area.
Moreover, the 2075 is the current all-time-high.
🏹 So the highlighted purple circle is a strong area to look for sell setups as it is the intersection of the green resistance and upper brown trendline. (acting as non-horizontal resistance)
As per my trading style:
As XAUUSD is sitting around the purple circle zone, I will be looking for bearish reversal setups (like a double top pattern, trendline break , and so on...)
Of course, UNLESS Gold breaks above 2075 in an aggressive manner, then the bulls will remain in control and we will expect an extended bullish movement.
📚 Always follow your trading plan regarding entry, risk management, and trade management.
Good luck!
All Strategies Are Good; If Managed Properly!
~Rich

ASIA: XAUUSD REVERSAL - MOMENTUMAsia has given us a reversal setup right out the play book! All criteria met = higher probabilities :)
Going for at least 2R

Potential downtrend for GOLD/USDChart analysis of resistance at $1831 for GOLD and potential targets in demand zone.

XAUUSD Longs XAUUSD has broken structure on the lower time frame and we are aiming for higher highs. However if price is able to trade back into one of these demand zones, we would like to take the opportunity to open trades in these areas. We would like to see some sort of reaction in one of these spots before we begin to enter the market, so lets see how these playout!


Possible RetestPossible Gold Retest to demand zone. Will price reverse to the upside for a Long-Setup?..

EUR/NZDEUR/NZD is looking like it is coming to the end of its correction there for i am looking for buy opportunities.
I would like to see the price come down further before entering a long position but if price decides to keep pushing up i will wait until price has broken the trendline & re tests structure.

gold in this week and interest rateThe USD interest rate will be released on July 28
If the dollar strengthens, gold will experience a heavy fall
if this idea is true. gold goes to price1670

GBPJPY - Running 330pips! Looking for 2nd Entry!In our previous analysis, we were looking to short on the break of trendline. Once broken. price consolidated a bit and then dropped 330pips so far!
We will be looking for the second entry on the break of the next correction. Look out for a bear flag and enter on the break of the flag.
Goodluck and trade safe!

Double Bottom on XAU/USD @ D1This double bottom pattern has formed on the daily chart of XAU/USD (Gold) and is ready for a breakout. The two bottoms are marked with the lower yellow line; the neckline is marked with the upper yellow line. My potential entry level is at the cyan line. My potential take-profit level is at the green line. Stop-loss can be set to the low of the breakout candle (not shown on the chart).

will GOLD be bullish?Several days before, gold was moving in a bearish trend, but if we look at the gold price entering the demand area in the past. I went into smaller timeframes and found a possible reversal pattern and maybe gold will form a cup and a handle.
disclaimer on! gold is a high risk financial instrument.

GOLD - Detailed Video Analysis - Trio Retest!Hello everyone, if you like the idea, do not forget to support with a like and follow.
Here is the top-down analysis for GOLD, feel free to request any pair/instrument or ask any questions in the comment section below.
Best of luck!

XAU/USD trading perpectiveGold price retraced, however a new leg with more momentum could occur. Price could easily tap $1830 which is in confluence with the -27.8%
retracement fib and the downward trendline.

Trend line indicating triggersJust to show how the rupture of trend lines often indicates a future reversal.
In a 5min time frame this chart would look much better, but we can still notice it.
If we see an anomaly both in regards to the trend line, volume contrary to the price, and or a specific candlestick, be aware of a trade opportunity.

XAUUSD pending reversal LONGCurrently pending reversal on XAUUSD. Expected to reverse before US Session Today.

Gold give us well-founded example of Reversal Strength by PINBARPinBar strength :
Looking at all Pin-bars, reversal occurs whenever long Pin-bar made. If the price closes 1706 around or above , there will be Pin Bar which is the sign of reversal. Gold give us well-founded example of Strength of Reversal.
If you take minutely the small things , you will know in advance the big things .

Gold - GC1 - Potential Reversal pattern - Head and Shoulders topIt might be a Reversal Pattern Head and Shoulders.
Volumes do not confirm this pattern and it should be read as warning for us traders.
Personally I would not invest in the GOLD Market.
For a short term trading the market seems to be bullish.

Gold: The next leg down.After Monday's short-covering/reaction/fake-out, gold put in a bearish pin bar on the daily chart. This should mark the end of the uptrend and gold should resume to the downside targeting 1210-1215. Remember June/July is a typical seasonal low point, so we should expect to see gold to put in a bottom during that time frame.

XAUUSD (GOLD) Deep Bullish CRAB Pattern Complete !The Deep Bullish Crab pattern is complete on the daily chart of this asset. Harmonic patterns are difficult to spot and when they do form particularly on the long term time frame they are of high probability and quality patterns. This is just my analysis for you to see and make the decision based on your personal analysis!
It is by no means a trade signal as i am a very cautious trader and i base my trade on multiple confluence factors rather than single. For those of you who wish to trade this pattern the target level are shown by the arrows (TP1 38.2 FIB LEVEL AND TP2 61.8 FIB RATIO). SL CAN BE PLACED at 1120.00 level. I stress again this is not a trade signal its just an analysis and if you do wish to enter please enter at your own risk. i have just put this completed pattern here as they are very hard to spot and as a trading community we are here to help each other out, so trade cautiously!
Cheers

IAU gold ETF reversal ?Weekly chart looks promising. The MA of 50 and 200 weeks have crossed for first time since 2005 (beginning of my chart) and they are heading away from each other a little less than 30 degrees. Could turn into a failed reversal, but something to keep an eye on. If this an upward trend starting it could be a steep climb up the chart. Who knows with precious metals and the daily's don't look as promising. Just an interesting weekly chart observation. Good luck everyone. Thoughts ?

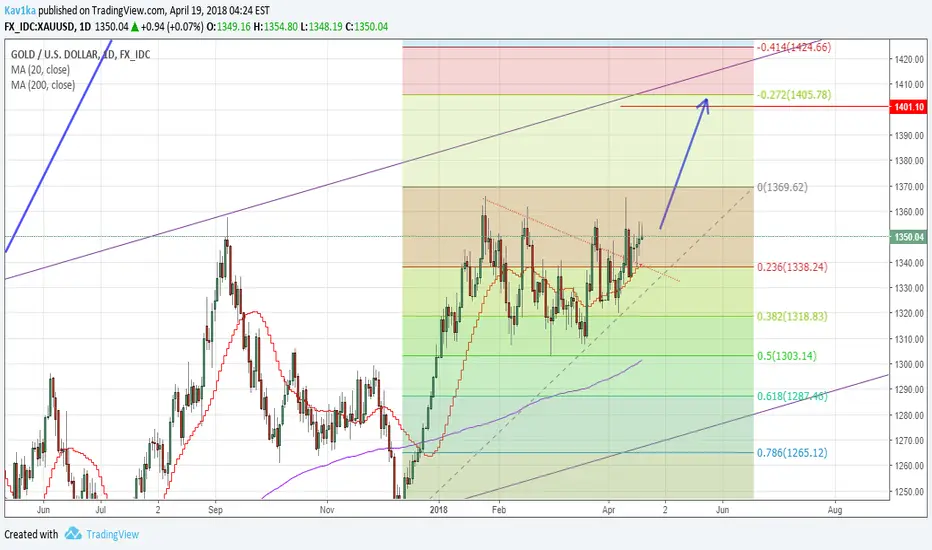
Is It Possible For Gold To Hit 1400? 1400 I think is a sweet spot for Gold. This and USD analysis are very much similar in terms of a near trend reversal. At least for a nice pull back slash correction.
Happy Trading, folks!
Cheers.