Gold and the direction of moving this weekGold price today is trading around US $ 2022 and is worth a significant recovery level since the last time it decreased to 2000 USD.
From the chart, precious metals have escaped from the discount channel and conducted an increase, the price can recover up to 2037 USD and higher may be at $ 2055.
However, the market information is still less optimistic about the possibility of the world gold price this week when gold continues to cope with the pressure of reduced from the possibility of the US Federal Reserve (Fed) holding interest rates higher than long longer than long. than. Most of the US economic data published in the past week showed that growth was still stable and inflation fell slower than forecast. Therefore, the market said that it was not until June that the Fed started to cut interest rates and the number of interest rates this year may not exceed 3 times.
The new expectation of the interest rate of US Treasury bond yields and the USD exchange rate maintain an increase trend, putting pressure on gold.
Gold-sell

EURUSD sellsEntered during London session, rejection from CE of the orderblock, targeting 1:3 RR
Trade I will hold through the day
Simple, see how it pans out

✅GOLD SWING SHORT🔥
✅GOLD will soon hit
A massive horizontal
Resistance level of 2062$
From where I will be expecting
A local move down
SHORT🔥
✅Like and subscribe to never miss a new idea!✅

GOLD Just LOOK At That Resistance! Sell!
Hello,Traders!
GOLD keeps growing just
As I predicted but just
LOOK at that massive key
Horizontal resistance level
At around 2080$ an ounce
The level is super strong so
I will be expecting a bearish
Correction after the retst
Sell!
Like, comment and subscribe to help us grow!
Check out other forecasts below too!

XAUUSD 12/11/23Gold giving us more bearish price action from last week we had a one bullish range which continued into a bearish order flow which we expected to happen we've now moved lower and we're expecting price to continue bearish into the beginning of this week with a midweek pullback which we will be keeping track of to possibly capitalise on buys overall we are still bearish on gold so use that as a strong indicator.
Remember to always read order flow and follow what price is showing you instead of trading based on your desired direction. And, as always, stick to your risk and your plan.
We'll be closely monitoring market openings and price action throughout the week. If you find this analysis useful, let us know in the comments below and hit the boost button to show your support. Here's to a successful week of trading!

7 dimension analysis Gold 🕛 TOPDOWN Analysis - Patience Required Amidst Supply Signals
Overview: The market presents an intriguing picture with four consecutive long-wick candles at the top, signifying a robust supply area. Big players seem hesitant to push prices higher than the previous high, warranting a watchful approach, especially in the context of the yearly chart. On the monthly chart, there is a clear uptrend with a well-defined cup and handle pattern. A substantial buildup at resistance levels suggests a wait-and-see stance, primarily for investors. The weekly chart signals a shift in the price dynamic, indicating bearish control until the last demand area or the next swing target zone.
😇 7 Dimension Analysis
Time Frame: Daily
1️⃣ Swing Structure: Bearish
🟢 Structure Behavior: Breakout from Sideways (BoS).
🟢 Swing Move: The impulsive move has achieved its target.
🟢 Inducement: Awaiting confirmation; additional sell entry planned.
🟢 Pull Back: A solid second pullback.
🟢 Internal Structure: Bearish.
🟢 Support or Demand Area: Identified as the next profit booking target, decisions will follow after booking profits. Awaiting Support Breakout/CIP at 1899.
2️⃣ Pattern
🟢 CHART PATTERNS
Continuation
Descending Triangle break signals a target around 1827.
🟢 CANDLE PATTERNS
Notable Observations:
A record session count with eight consecutive bear candles suggests potential continuation until the target.
Momentum indicates bearish candle formation.
3️⃣ Volume:
Volume has been substantial during the entire move, with no signs of weakening.
Volume on the breakout consistently indicates lower volume at base levels followed by significant volume during the follow-up.
4️⃣ Momentum RSI:
🟢 Zone: Super bearish.
🟢 Loud Moves: Price movement transitioning from sideways to bearish, indicating expectations of further bearishness.
🟢 Overbought/Sold Rejections: Currently count at 0.
5️⃣ Volatility Bollinger Bands:
🟢 Move Commencement: Following a Squeeze spanning over 10 candles in the range.
🟢 Squeeze Breakout: Expectation of a move outside the lower band.
🟢 Walking on the Band: Ongoing trend adherence, with price respecting this trend.
6️⃣ Strength ADX:
Bears currently exhibit complete control in the market at this point.
7️⃣ Sentiment ROC:
Indicates that this is the weakest commodity in the last week.
✔️ Entry Time Frame: H1
✅ Entry TF Structure: Bearish
☑️ Current Move: Impulsive.
✔ Support Resistance Base: Last established base.
☑️ Candles Behavior: Reflects characteristics like RSC, Longwicks, Doji, and Inside candles.
☑️ FIB Trigger Event: To be assessed at the sell area.
☑️ Trend Line: To be drawn once the price reaches the sell area.
☑️ Final Comments: Waiting for the right moment to sell.
💡 Decision: Sell at correction.
🚀 Entry: 1870
✋ Stop Loss: 1884
🎯 Take Profit: 1820, 2nd Exit if Internal Structure Changes, 3rd Exit on a trendline breakout or FOMO signal.
😊 Risk to Reward Ratio: 1:3.5
🕛 Expected Duration: 7 days
SUMMARY: The market exhibits a strong supply area with a need for vigilance. Various charts, including the yearly, monthly, and weekly, provide insights into the bearish sentiment. The daily analysis indicates a bearish structure with planned sell entries. Volume, momentum, and candle patterns further support the bearish outlook. Patience is advised for a well-timed sell. Specific entry, stop-loss, and take-profit levels are provided, with a risk-reward ratio of 1:3.5.

Gold potential downsidesHey Traders, in the coming week we are monitoring XAUUSD for a selling opportunity around 1870 zone, GOLD is trading in a downtrend and currently is in a correction phase in which it is approaching the trend at 1870 support and resistance area.
Trade safe, Joe.

XAUUSD Potential DownsidesHey Traders, in today’s trading session we are monitoring XAUUSD for a selling opportunity around 1920 zone, XAUUSD was trading in an uptrend and successfully managed to break it out. Currently is in a correction phase in which it is approaching the retrace area at 1920 support and resistance area.
Trade safe, Joe.

XAUUSD 10/9/23XU giving us a similar thing, a clean swing range to the downside after tapping into our POI we shifted massively down. we are looking for this to run the low, the same as we are looking to sweep our highs (correlation) if we don't take the low then il be waiting for a break of either he low or high based off of our open we might just take the low straight away.
Remember to always read order flow and follow what price is showing you instead of trading based on your desired direction. And, as always, stick to your risk and your plan.
We'll be closely monitoring market openings and price action throughout the week. If you find this analysis useful, let us know in the comments below and hit the boost button to show your support. Here's to a successful week of trading!

Gold Potential DownsidesHey Traders, in today's trading session we are monitoring XAUUSD for a selling opportunity around 1937 zone, Gold was trading in an uptrend and successfully managed to break it out.
Currently is in a correction phase in which it is approaching the retrace area at 1937 support and resistance area.
Trade safe, Joe.

GOLD Will Move Lower! Sell!
Here is our detailed technical review for GOLD.
Time Frame: 2h
Current Trend: Bearish
Sentiment: Overbought (based on 7-period RSI)
Forecast: Bearish
The market is testing a major horizontal structure 1944.664.
Taking into consideration the structure & trend analysis, I believe that the market will reach 1930.940 level soon.
P.S
We determine oversold/overbought condition with RSI indicator.
When it drops below 30 - the market is considered to be oversold.
When it bounces above 70 - the market is considered to be overbought.
Like and subscribe and comment my ideas if you enjoy them!

XAUUSD 27/8/23XU is the first of our USD correlated pairs and from this you will see a very similar markup for all of the USD related pairs.
This setup is showing you we are looking for sell moves overall, BUT this range was created by a news events (Jackson hole) so we don't want to blindly follow the bias down when we know the news event ranges often prove many traders wrong, this is exactly why we don't jump in as we would with a normal trend move.
So as it stands we are looking at a news range that tells us we want to run the sw low, we will wait for price to tap into our POI if it is willing to deliver to it, once we get to the POI we are only entering if we see a clear confirm and breakdown in our favour.
Lets keep and open mind for this as we are fully aware of the probability of this playing out fully.
Remember to always read order flow and follow what price is showing you instead of trading based on your desired direction. And, as always, stick to your risk and your plan.
We'll be closely monitoring market openings and price action throughout the week. If you find this analysis useful, let us know in the comments below and hit the boost button to show your support. Here's to a successful week of trading!

Gold D Sell Idea 7/29/23Gold D has formed a M. Friday was the retest of the neckline for that M. There has also been a bearish break and retest of a W trendline on the daily.
The 4H has hit 50% of the FVG (fair value gap) that was created and started to drop. The W trendline has not been closed above on the 4H time frame.
The 1H has created an evening star at the 4H FVG, also having a bearish break and retest on the W trendline.
Looking for price to continue bearish possible to the D Zone created 7/6/23 around 1911.00. At the least price should fall to Fridays low around 1945.53, a good 137+ pips from where price closed on Friday.

XAUUSD Daily breakdownGold closed below the 1922.62 support level - in the past when price has closed below here we see price tap 1903
With this in mind, the most optimal trade entry would be taking a sell at 1927 - why? because if you look at price action in the past, there is always a tap on that price level as price moves down and we haven't seen that yet.
Keep in mind we have CPI news today for the USD so we will have volatility no matter what, we may wait until after news to take trades to be safe.

XAUUSD SellsTargeting sells on USD pairs today, gold seems to have risen overnight through LONDON. Im watching to see a rejection from a previous LH on the 30m chart. Also implementing Killzones into my trading, testing the waters with how they work for my strategy.

NZDUSD LongsLooking to buy NU, Channeling down our channel nicely, watching for that rejection up towards the top of our trend.

Retest of 1911Gold is looking to pullback to 1911 support. Here i will watch for a break or a rejection. Im targeting sells this week, I believe 1895 will come in time.

Golds Recent PushGold has been pushing upwards the past week, 1963 area seems to have formed a resistance of price. I have implemented kill zones into my strategy now. Also looking to sell from rejection of resistance, but, price could push through from CPI and Retail Sales news at 1:30pm GMT.
Caution on USD and CAD pairs at this time.

XAUUSD 16th JulyGold has shown us its looking for lower prices after we shifted out of the buy range on Friday, this leads us into this week and what we can see is a range that's showing us lower moves but we don't have a valid low of this range meaning we have to wait for this range to fail or shift price lower again.
Remember to always read order flow and follow what price is showing you instead of trading based on your desired direction. And, as always, stick to your risk and your plan.
We'll be closely monitoring market openings and price action throughout the week. If you find this analysis useful, let us know in the comments below and hit the boost button to show your support. Here's to a successful week of trading!

Golds RangeKey support and key resistance for gold lay between 1910 and 1895.
We could see gold sink further today, once key support is broke gold could drop to 1880 and lower. Lots of news to keep an eye on also. I will be looking to sell from rejections around 1910.

Golds Recent DeclineGold continues to fall after breaking key range,
Golds forming a bearish channel, again what I spoke about yesterday. Also looking like a bearish wedge is forming.
Gold is approaching the key support of 1895. Possible rebound from the level to the nearest resistance I predict.
The trend is clearly bearish, I’ll be targeting sells today. If another key support is broken it will push the price further down.
I predict a retest of 1895 soon
Another support level of 1910 is broken and price is forming a consolidation below the level, also that impulse I spoke about yesterday.
Support 1895
Resistance 1910

Gold Break The 1900's?With golds fall over the recent days, its clear to see its in a bearish channel. Im looking to sell now and target 1900, 1885 in the mid term.
Price below 1910 will cause an impulse to 1900, Sell entered at 1912, let the melt begin...

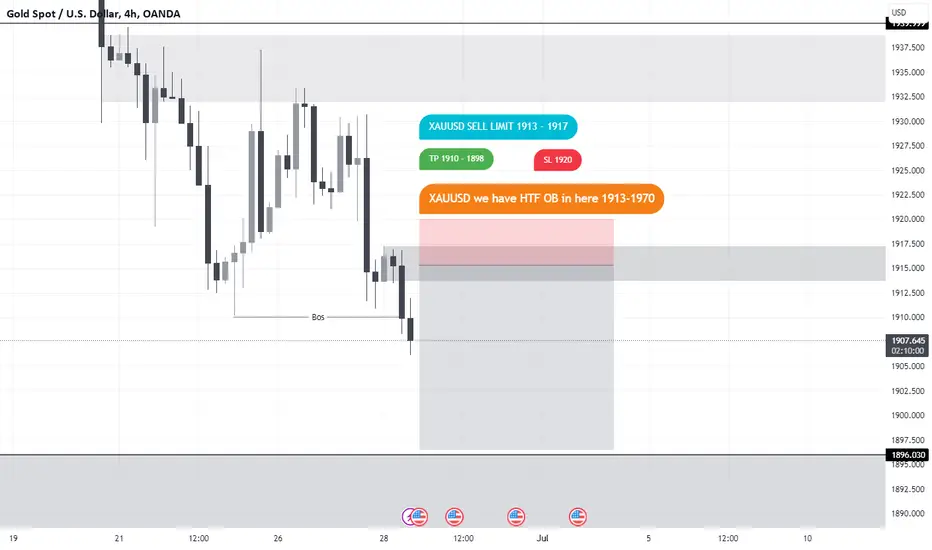
XAUUSD (GOLD) SELL LIMIT 1913-1917XAUUSD we have HTF OB in 4H time frame if can't break the zone we can sell in here and tp 1910 to support zone 1890 and if can break can rise to next OB 1932-1938