XAU/USD 14 April 2025 Intraday AnalysisH4 Analysis:
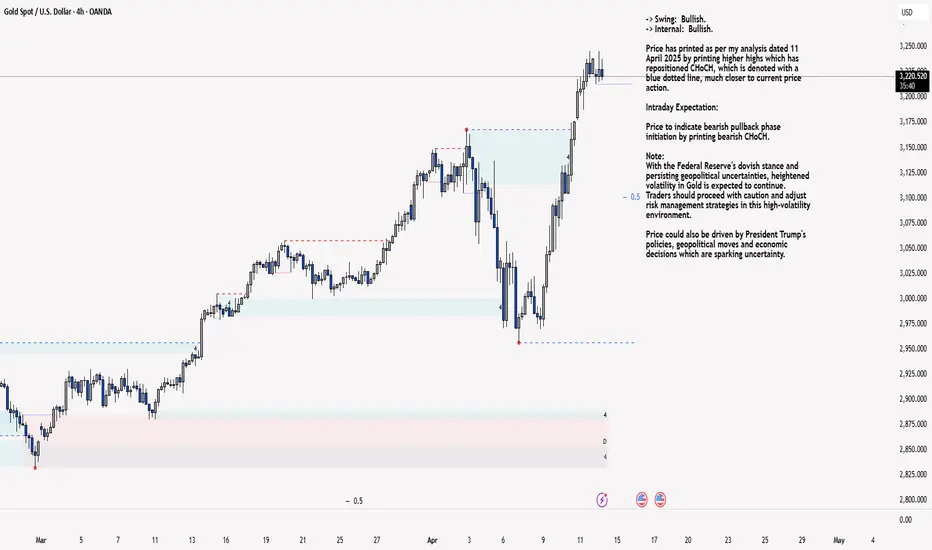
-> Swing: Bullish.
-> Internal: Bullish.
Price has printed as per my analysis dated 11 April 2025 by printing higher highs which has repositioned CHoCH, which is denoted with a blue dotted line, much closer to current price action.
Intraday Expectation:
Price to indicate bearish pullback phase initiation by printing bearish CHoCH.
Note:
With the Federal Reserve's dovish stance and persisting geopolitical uncertainties, heightened volatility in Gold is expected to continue. Traders should proceed with caution and adjust risk management strategies in this high-volatility environment.
Price could also be driven by President Trump's policies, geopolitical moves and economic decisions which are sparking uncertainty.
H4 Chart:
M15 Analysis:
-> Swing: Bullish.
-> Internal: Bullish.
As mentioned in previous analysis that I will continue to monitor internal structure following the printing of a bearish CHoCH.
Due to the extreme bullishness of the market I will be mapping internal structure as it appears.
The reasoning behind this due to the fact of the increasing range of the internal structure. By mapping internal structure as it appears we are more likely to be in a good position to have an early warning of all HTF bearish pullback phase initiations.
Price has printed a double bullish iBOS since last analysis and we are now trading within an establish internal range where you will note that price has printed a double top and has been unable to close above weak internal high.
Intraday Expectation:
Technically price should target weak internal high priced at 3,244.340.
Alternative scenario:
Due to the narrowing of internal range, it could be a potential early signal that all HTF's are beginning their bearish pullback phase initiation. I would therefore not be surprised if price printed a bearish iBOS.
Note:
With the Federal Reserve maintaining a dovish stance and ongoing geopolitical tensions, volatility in Gold prices is expected to remain elevated. Traders should exercise caution, adjust risk management strategies, and stay prepared for potential price whipsaws in this high-volatility environment.
Trump's tariff announcement will most likely cause considerably increased volatility and whipsaws.
M15 Chart:
Goldmarketforecast
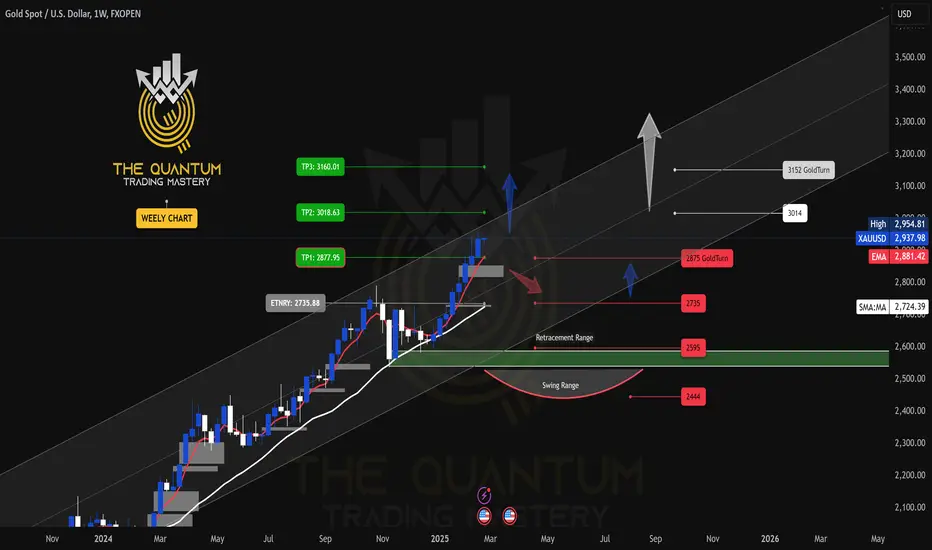
GOLD WEEKLY CHART MID/LONG RANGE ROUTE MAP UPDATEDWeekly GOLD Analysis: 24th February 2025
Hello Traders,
Here’s a weekly chart analysis of GOLD, offering an in-depth look at recent market trends and future outlook. Since October 2023, our consistent tracking has achieved 100% target accuracy, as shown by the Golden Circle markers on the charts. Let’s break down the highlights and what’s next.
Gold reached an all-time high of $2,954.80 last week. As previously noted, close attention to the movement of the 5-day Exponential Moving Average (EMA5) was advised. The anticipated Fair Value Gap (FVG) provided strong support at $2,850, with the EMA5 approaching the first take-profit (TP1) level at $2,877, leading to a bullish surge that touched the all-time high. However, the EMA5 has yet to cross and stabilize above $2,877.
This situation persists, with the EMA5 still not locked above $2,877, which is necessary for further bullish confirmation. If the EMA5 fails to cross and hold above this level, the price may reverse to test the GoldTurn level at $2,875 before potentially bouncing back upward.
The key level at $2,735 remains a critical zone. Active GoldTurn levels at $2,875 and $2,735 suggest that the price may revisit these areas before advancing to TP1 and beyond.
Recommendations & Strategy:
* Focus on EMA5: Watch its behavior around 2877 for key signals on short- and long-term trades.
* Support Levels: GoldTurn levels at 2875 and 2735 are vital for identifying reversal points and prime dip-buying opportunities.
* EMA5 detachment is still due on weekly chart.
For precise entry and exit points, check our daily, 12H, 4H, and 1H analyses for clearer market guidance.
We’ll continue to provide daily updates, insights, and strategies on our TradingView and YouTube channels every Sunday. Don’t forget to like, comment, and share to support our work and help others benefit!
The Quantum Trading Mastery
Wall Street vs GoldZilla. The End of 'Irrational Exuberance' Era"Irrational exuberance" is the phrase used by the then-Federal Reserve Board chairman, Alan Greenspan, in a speech given at the American Enterprise Institute during the dot-com bubble of the 1990s. The phrase was interpreted as a warning that the stock market might be overvalued.
Origin
Greenspan's comment was made during a televised speech on December 5, 1996 (emphasis added in excerpt)
Clearly, sustained low inflation implies less uncertainty about the future, and lower risk premiums imply higher prices of stocks and other earning assets. We can see that in the inverse relationship exhibited by price/earnings ratios and the rate of inflation in the past. But how do we know when irrational exuberance has unduly escalated asset values, which then become subject to unexpected and prolonged contractions as they have in Japan over the past decade?
Greenspan wrote in his 2008 book that the phrase occurred to him in the bathtub while he was writing a speech.
The irony of the phrase and its aftermath lies in Greenspan's widely held reputation as the most artful practitioner of Fedspeak, often known as Greenspeak, in the modern televised era. The speech coincided with the rise of dedicated financial TV channels around the world that would broadcast his comments live, such as CNBC. Greenspan's idea was to obfuscate his true opinion in long complex sentences with obscure words so as to intentionally mute any strong market response.
The phrase was also used by Yale professor Robert J. Shiller, who was reportedly Greenspan's source for the phrase. Shiller used it as the title of his book, Irrational Exuberance, first published in 2000, where Shiller states:
Irrational exuberance is the psychological basis of a speculative bubble. I define a speculative bubble as a situation in which news of price increases spurs investor enthusiasm, which spreads by psychological contagion from person to person, in the process amplifying stories that might justify the price increases, and bringing in a larger and larger class of investors who, despite doubts about the real value of an investment, are drawn to it partly by envy of others' successes and partly through a gamblers' excitement.
The main technical graph represents a value of S&P500 Index in Gold troy ounces (current value 1.81 at time of writing this article), indicates that effusive Bull stock market goes collapsing.
--
Best wishes,
Your Beloved @PandorraResearch Team 😎

GOLD DAILY CHART MID/LONG TERM UPDATEGOLD Daily Chart Update: 17the FEB 2025
Hello Traders,
Here’s the latest update on the GOLD daily chart, which we've been closely monitoring and trading. Below, we break down recent price movements, updated key levels, and provide actionable insights for the days ahead.
Recap of Recent Chart Success!
Our recent analysis has proven highly accurate:
ENTRY LEVEL 2744: ✅ Achieved
TARGET TP1 (2807): ✅ Achieved
TARGET TP2 (2870): ✅ Achieved
TARGET TP3 (2933): ✅ Achieved
What’s Next for GOLD? Bullish or Bearish?
Last week, GOLD reached an all-time high of 2942.59. Currently, the price is fluctuating between the gap above 2933 and the gap below 2870. 2933 is acting as a key resistance level, and an FVG (Fair Value Gap) has formed to reinforce this resistance. As a result, our GoldTurn levels are now activated as key support zones.
KEY LEVEL: 2870
Resistance Levels: 2933, 2990, 3051
Support Levels (GoldTurn Levels): 2870, 2801, 2744, 2671, 2595
EMA5 Behavior:
* Or If EMA5 crosses and locks above 2933, it strengthens the bullish case.
* If EMA5 fails to hold above 2870, cross and lock below this level 2870, expect a pullback to key GOLDTURN levels below.
Recommendations:
* Capitalize on Dip Opportunities: Use smaller timeframes (1H, 4H) to trade around GOLDTURN levels, targeting 30–40 pips per trade.
* Stay focused on shorter trades in this range-bound market to manage volatility effectively.
Long-Term Bias:
Maintain a bullish outlook while viewing pullbacks as buying opportunities.
Accumulate positions near key support levels for a safer approach instead of chasing highs.
Final Note:
Trade with confidence and precision. Our analysis ensures you’re well-prepared to navigate the evolving market landscape. Stay updated with our daily insights across multiple timeframes for deeper clarity.
Thank you for your continued trust! Don’t forget to like, share, and comment to support our work.
Best regards,
The Quantum Trading Mastery Team

GOLD 4H ROUTE MAP TRADING PLAN FOR THE WEEKGOLD 4H Chart Analysis – 24th Feb 2025
Hi Everyone,
Please see our updated 4h chart levels and targets for the coming week.
Review of Previous Chart:
Entry Level: 2814 ✅
Take Profit 1: 2850.15 ✅ (Hit)
Take Profit 2: 2876.95 ✅ (Hit)
Take Profit 3: 2903.76 ✅ (Hit)
Take Profit 4: 2925.85 ✅ (Hit)
Take Profit 5: 2952.70 ✅ (Hit)
To Achieve TP6, TP7 and TP8, please consider the following scenario below. Read the caption carefully.
Key Level: 2876
Resistance Level: 2952, 2984, 3017, 3052
Support Levels (Goldturn Levels) : 2925, 2900, 2876, 2852, 2828, 2803, 2776, 2747
GOLDTURN KEY LEVELS ARE ACTIVATED at zone 2925 and below.
EMA5 Behavior (Red Line):
Current EMA5: 2935.28
FOCUS ON EMA5 REACTION DEEPLY
* EMA5 is fluctuating between two key weighted levels, with a gap above 2952 and below the 2925 GoldTurn level.
* A crossover of EMA5—either above or below the weighted level—will signal the next significant move for GOLD.
Bullish Targets
EMA5 cross and lock Above 2952, will open the following bullish target 2984
EMA5 cross and lock Above 2984, will open the following bullish target 3017
EMA5 cross and lock Above 3017, will open the following bullish target 3052
Bearish Targets
EMA5 cross and lock Below 2925: will open the following bearish target 2900
EMA5 cross and lock Below 2900: will open the following bearish target 2876
EMA5 cross and lock Below 2876: will open the following bearish target 2852
EMA5 cross and lock Below 2852: will open the following bearish target 2828
EMA5 cross and lock Below 2828: will open the following bearish target 2803 (Retracement Range)
EMA5 cross and lock Below 2803: will open the following bearish target 2747 (Swing Range)
Trading Plan:
* Stay bullish and buy pullbacks from key levels.
* Avoid chasing tops—focus on buying dips.
* Use smaller timeframes for entries at Goldturn levels.
* Aim for 30–40 pips per trade for optimal risk management.
* Each level can yield 20–40+ pips reversals.
ong-Term Outlook:
Maintain a bullish bias while using pullbacks as buying opportunities.
Buying near key support levels ensures better entry points and mitigates risks, avoiding the pitfalls of chasing tops.
Trade with confidence and discipline. Stay tuned for our daily updates! Please support us with likes, comments, and follows to keep these insights coming.
📉💰 The Quantum Trading Mastery

"Gold (XAU/USD) Forming Inverse Head & Shoulders – Bullish BreakThis chart represents the technical analysis of Gold Spot (XAU/USD) on a 1-hour timeframe. Here are the key insights:
### **1. Head and Shoulders Pattern:**
- The chart suggests a possible **inverse head and shoulders** formation.
- **Left Shoulder:** Marked at a recent price dip.
- **Head:** A lower dip indicating a strong support level.
- **Right Shoulder:** Expected to form at a slightly higher level than the left shoulder.
- This pattern is **bullish**, indicating a potential price reversal to the upside if the neckline (resistance level) is broken.
### **2. Bearish Flag & Downtrend Resistance:**
- A **bearish flag** is drawn on the chart, showing a downward sloping channel.
- The price is currently trying to break out of this downtrend.
- A successful breakout above this resistance could lead to bullish momentum.
### **3. Key Levels:**
- **Major Resistance:** **$2,952.784** (Highlighted in red).
- **EMA 200 Support:** **$2,899.278** (The blue moving average line).
- **Current Price:** **$2,908.690**
- **Main Support Area:** The green trendline supports the potential right shoulder.
### **4. Possible Market Movement:**
- The red arrows suggest a **bullish breakout** scenario.
- The price may test support around the green trendline before pushing higher.
- If the inverse head and shoulders pattern plays out, the price could move toward the **$2,950+** resistance.
### **5. Conclusion:**
- **Bullish Scenario:** If price breaks above the neckline, it could continue towards **$2,950 - $2,960**.
- **Bearish Scenario:** If price fails to hold the right shoulder support, it may drop back toward **$2,880 - $2,860**.
By KingProTrader

Short trade in progressBros, today's trading view is very clear. We still continue to short gold, and there is no problem in making 200-300pips of profit in the short term.
Gold faces multiple key resistances above 2930. It is difficult to have enough momentum to break through the multiple key resistances above in the short term; and before the NFP market on Friday, both long and short sides are relatively cautious, and it is difficult to form a unilateral trend market. The overall market still fluctuates within the range. So I think shorting gold is still profitable.
In terms of short-term trading, I have taken the 2930-2940 area as resistance and shorted gold below 2930. At present, gold has fallen back to below 2920. Our short position has made a good profit. What we need to do now is to wait patiently for gold to continue to fall back, so as to bring us more lucrative profits.
Bros, did you follow me to short gold? Wise choices are far greater than hard work. Only by following the right people can we execute the right transactions and accumulate profits that change our lives and destiny. If you want to copy trading signals and make stable profits, or want to learn the correct trading logic and techniques in depth, you can consider joining the channel at the bottom of this article!

Continue to short gold after the reboundAfter sideways consolidation, gold chose to move downward again, and the current situation and direction are very clear. 2956 has basically been confirmed as the current stage high, so in the New York trading session, we only need to find the right time and point to short gold.
However, although the decline of gold just now was strong, it still seemed a little hesitant when facing the low point last night. There is still a certain support in the intraday, and the gold price will more or less rebound. The resistance area above is the 2915-2925 zone, so I will short gold with the resistance of this area, and gold will definitely touch the 2880-2870 zone or even lower during this round of decline.
Bros, profits are the ultimate goal in trading. Accumulating profits is what changes lives and destinies. Choosing wisely is far more important than just working hard. If you want to replicate trade signals and earn stable profits, or if you want to deeply learn the correct trading logic and techniques, you can consider joining the channel at the bottom of this article!

Any rebound is an opportunity to short goldAs I mentioned in my previous article, after a period of sideways consolidation, gold chose to break downward—signaling greater downside potential. We perfectly captured the shorting opportunity around the 2935-2945 resistance zone. Gold not only successfully hit the 2910-2900 target area but even exceeded my expectations, with the price bottoming out around the 2888 region. This was an excellent short trade, and I personally gained over $10K in profits from this position.
Currently, gold is hovering around the 2890-2888 region, and while the downtrend has momentarily slowed, the bulls have yet to mount any effective counterattack. This indicates weakening bullish sentiment, and with earlier profits being cashed out alongside follow-up and panic-driven selling, the bearish trend is likely far from over. Breaking below the 2890 support further opens the door for continued downward movement, increasing gold’s potential for deeper declines.
For short-term trades, any rebound in gold’s price could present fresh opportunities for short positions. We should closely monitor the 2910-2920 area for potential entries to short gold once again.Bros, profits are the ultimate goal in trading. Accumulating profits is what changes lives and destinies. Choosing wisely is far more important than just working hard. If you want to replicate trade signals and earn stable profits, or if you want to deeply learn the correct trading logic and techniques, you can consider joining the channel at the bottom of this article!

Profitable trading methodsDear Traders,
Since yesterday, I have maintained my short strategy on gold, entering small positions at 2919, 2927, and 2939, with a TP set at 2916. Gold faced resistance near the 2940 zone and has since retraced, hitting the TP of 2916 as expected. All of our short positions were closed with a profit when the TP was reached.
Based on the current structure, the 2940 region remains a significant resistance zone for gold in the short term. If gold fails to break this resistance, it could potentially form a double top pattern, which would favor further downside movement. We should first focus on the support at 2915-2910, and then monitor the 2900-2895 region for additional support. If gold manages to hold above 2900 during the pullback, we should avoid aggressively chasing short positions, as a potential liquidity increase could attract more buying interest.
For the upcoming trades, there are two possible scenarios:
1. If gold rebounds above 2930, we can consider shorting again.
2. If gold maintains support above 2910-2900 or fails to break below this range, we could look to take long positions.
Bros, have you followed me to short gold and made a profit? If you want to learn more detailed trading ideas and get more trading signals, you can choose to join the channel at the bottom of the article to make trading no longer difficult and make making money a pleasure!

XAUUSD Goes Long. Let's Make Gold Shining Bright Again. As of January 21, 2025, the price of Gold spot is trading nearly at $2750. The recent price movements and technical indicators suggest a bullish sentiment in the gold market.
Recent analyses indicate a strong bullish trend for gold, supported by various technical indicators:
Moving Averages:
Strong Buy signals across all moving averages, from Short-term (5-day) Simple Moving Average (SMA) to Long-term (200-day) SMA , and that is suggesting a bullish outlook, supported also by 125-day SMA earlier in Q4 2024.
Support and Resistance Levels:
Resistance Levels: The key resistance level is set around $2800.
Support Levels: Immediate support can be observed near $2720, as Reversed Head-and-Shoulders technical structure is happening right now.
Market Sentiment:
The overall market sentiment appears to be optimistic due to factors such as:
A weakening US Dollar, which typically boosts gold prices.
Anticipation of potential interest rate cuts from the Federal Reserve, which could further enhance gold's appeal as a safe-haven asset.
Despite of dirty political tricks, Gold spot overperforms major US stock indices so far in 2025, and has printed already several new ATHs in 2025 against Euro OANDA:XAUEUR and British pound OANDA:XAUGBP
In conclusion, the technical analysis for gold indicates a strong bullish trend with positive momentum, although caution is advised due to overbought conditions in some indicators.

Gold Market Breakdown: Unfolding Patterns and Key Price MovementGood morning Traders,
Trust you are doing great.
Allow me to continue my storyline of the Gold market.
In my previous analysis of the gold market, I identified two unfolding patterns with similar directional implications. While one pattern was invalidated, the other continues to develop as expected. I projected an appreciation in the gold price from 2370.930 to the 2430-2442 region, which has materialized with gold rallying to 2425.540, where it is currently encountering resistance.
Additionally, a new bearish Gartley pattern has emerged, suggesting a potential decline towards 2314.318 to complete the D-leg of the earlier identified unfolding bullish Gartley pattern. Supporting this bearish outlook are the following factors:
1. The current gold price has met the minimum requirement for leg C of the larger unfolding Gartley pattern, even though there are still room to the upside, but it shouldn't exceed 2436.857.
2. A fully formed smaller bearish Gartley pattern has been observed on the H1 timeframe.
3. The price is currently at a key supply zone that coincides with a critical level in our analysis.
Given these observations, I anticipate a significant drop in the gold price. However, if the price exceeds the maximum harmonic level for the formation of leg C of the unfolding bullish Gartley pattern at 2436.857, this outlook will be invalidated.
Cheers and happy trading!!!
