IXIC Update 14 August 2019Daily Data for Wednesday 14 August 2019
In Bear Territory
Price Projection: 7587
HMA: Very Strong Bear
BSI: Bearish
Bull RSI: Neutral
Bear RSI: Bear
5 RSI: Negative
Consolidation:Broken to the low side
Price- Trend: 2.1x ATR
Prices are now 2.1x ATR away from the mean. Expect some mean reversion (return toward the MAs) before any further movement.
Attached yahoo finance article regarding the futures position for the 15 August 2019. This is an example of set-up for a reversion to the mean. We may start there and fall or we may start low and move high. What ever the case may be. Prices don't like being 3x or more away from the mean.
Ixic-nasdaq
IXIC Update 13 August 2019Daily Data for Wednesday 13 August 2019
In Bear Territory
Price Projection: 8104
HMA: Bear/Cover Short
BSI: Bearish
Bull RSI: Neutral
Bear RSI: Neutral
5 RSI: Positive
Consolidation: 8065 - 7833 (re-established)
Price- Trend: .1x ATR
The prices closed in a zone of indecisiveness - this generally suggests covering shorts as it waits for renewed strength to build.
In this area, while in consolidation, no more triggers will be acknowledged until the consolidation is broken.
The consolidation zone is very tight for this index. SO we will not have to wait long as the ATR (Average Trade Range) is ~109/day.
IXIC Update week ending 26 July 2019Weekly consolidation range: Broken to the high
Daily consolidation range: Broken to the high
Weekly strength indicates a strong bullish attitude
Daily strength indicates a strong bull attitude
Weekly Bull RSI: No new signals
Weekly Bear RSI: Projection to: 8730
Weekly BSI: No new signals
Open daily price projections: 8392, 8395 from July 24, 8395 from July 26
Projected trade range for upcoming week: 8222 - 8614
Week ending 7-12-19Lot's of strength - new records have been made
The daily close is almost 2x the average trade range, so I anticipate a stall at some point this coming week to allow the averages to catch up.
Price projections from July 10 indicate a strong push to 8295 - 8305
Range for the coming week: 8138-8522.
DotCom (NASDAQ) Prepared Sideways action this summer for us?!Expecting price movement inside expanding wedge within upcoming next months to form bearish divergence and revisiting 7600 price level area, to make another motive impulse leg up
SHORT accumulation area 8400-8300-8200-8100
Fix them in long-accumulation area:
LONG accumulation area 7400-7500-7600-7700
Targeting 8200-8400-8600-8800 and more
(IXIC) (QQQ) Nasdaq Experiencing a Much Needed Price CorrectionIn my opinion we are in the middle of a necessary price correction.
-We should see a short term downside reversal put an end to the recent rally.
-We should see some highly volatile weeks with some sideways movement for the remainder of 2019.
-We should see the ABC correction come to an end with price catching support to ultimately form a new bullish channel
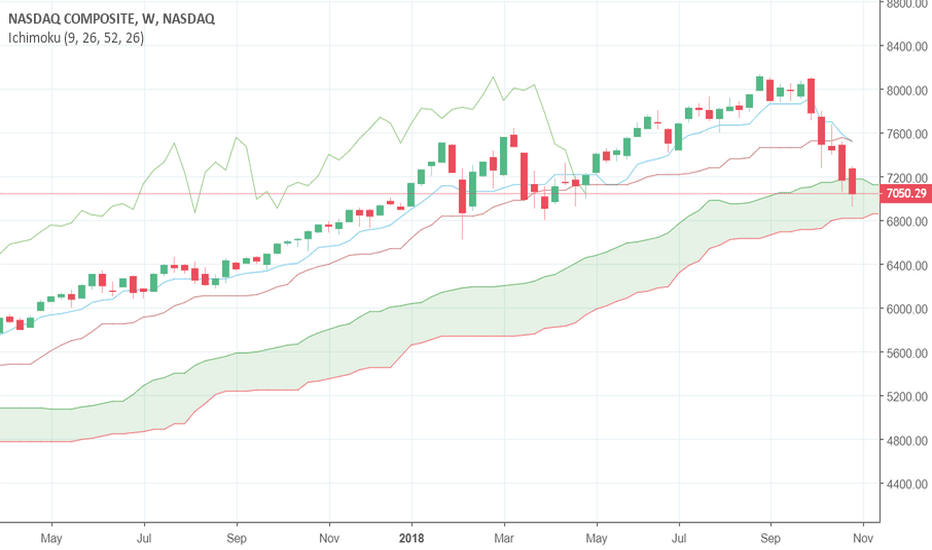
IXIC/Nasdaq100 shorting opportunityHere we have IXIC closing above Fib Guppy and Tenkan, showing strength and upward momentum to be expected.
there is a heavy resistance at 7.6k that if not broken will signal lower lows for the month--will will be a great short opportunity.
weekly close within or below fib guppy will signal downward continuation with Tenkan and kijun sitting at 7.3k and 6.9k as possible retested supports.
For now, Waiting for new weekly open will be advised.
@AresTrade
IXIC: Bubble or Brief Bear Market?I'm going to share some of my thoughts on technology stocks, and talk about why I am concerned about the future of tech stocks / Nasdaq composite.
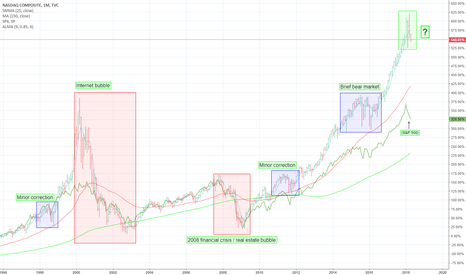
The red boxes indicate major pullbacks, the blue boxes representing short bear markets. One thing to note is that the bear markets indicated in blue are tradable, whereas the major pullbacks in red really aren't. Through this analysis I'm attempting to determine how much longer the Nasdaq/S&P 500 as a whole will remain tradable in the near future.
Throughout this, I will not be focusing on fundamentals, rather technical and trend analysis. My personal philosophy is that it doesn't matter how healthy the company, humans are emotionally driven (I say this despite the fact that the majority of trades are executed by artificial intelligence/bots, but who made those?). I prefer simply to look at trends which display a mixture of human emotional sentiment and fundamental health surrounding the company.
As I discussed in my long-term analysis of the DJI, crashes are often correlated with large deviation from moving averages (in this case I'm using 25M and 150M moving averages). The IXIC hasn't even hit the 25M moving average in over 6 years, and is well above it currently.
Another thing I want to look at is the nature of the run leading to a drop, and what it has looked like historically. Looking at the dotcom bubble, we see massive runs up before ultimately the realization that everything (for the most part) was getting overvalued due to emotionally driven and speculative trading. We see this less so with the 2008 crisis, but the dip is more pointed, like a triangle (or one of these symbols ^), as opposed to rounded like we see with a mini bear market. Currently IXIC looks more pointed (I'm sure there's a better term for "pointed", but you get the idea).
The last thing I noticed was that there was large deviation from the SPX during the internet bubble, and once it popped, they were congruent once more.
What I'm doing to prepare / be cautious of a potential dip: I haven't been fully invested since I added more money a few months ago. I am playing relatively safe and locking in gains pretty early. This has allowed me to make some small gains even throughout this shaky market. I would cite percentage gains but It's a little complicated since I just added money, it would get skewed, but I am indeed in the positive for the month, and for the last two months, despite the turmoil surrounding the market. If you don't count the added money, I'm up about 7% in the last 2 months. Currently I am completely uninvested as I expect some more pullback.
Note: I copied the idea of notating the full corrections and mini bear markets as red and blue, respectively. I've linked that idea below.
What do you guys think?
-Kristian


