Kumobreakout
Bearish Triangle Break + Support/Resistance ZonesTriangle has broken multiple bars in the 1H and 2H time-frame in to Bearish signals.
RSI @ 3H has turned Bearish as well.
Willy @ 6H is indicating a dump in near future.
I have labeled zones of varying degree of support/resistance (Green, Red, Yellow Lines)
These lines were drawn with 2H, 4H, 6H, 12H time-frame modified Ichimoku Kumo Clouds (hidden).
The question: where is the bottom?
If price breaches the yellow line inside the red square area - we will have a medium/strong indication we have entered a new Bearish Trend - and may see a short bounce @ $1150. However, if we hit $1150 I give it very low odds of holding for long.
The first likely target would be around ~$1085. This would be the bottom of the 6H Kumo cloud. If we breach this odds are extremely high for a retest of last months lows or a temporary bounce around ~$1000.
We have extremely strong support in the ~$950-$975 area where we may see some sideways action for a bit.
Worst case scenario is a flash drop to at minimum ~$887 (last lowest low)
Now would be a good time to put in limit orders spread between $825-$890
USDJPY - 5th wave complete? Looking for confirmation....It's looking like the 5th wave is now complete and this pair could finally see some bullish action. I plan to enter two positions....Firstly when the 4hr descending trendline is broken and secondly on a break and re-test of the kumo cloud. Both trades offer at least 1:2 risk to reward ratio and this is my trading plan for this trade.
WAITING FOR KUMO BREAKOUTI already have shorts at 140.630.
Price is ranging in the Kumo at the moment with KS resting and Ts showing a slight move down. Not enough confirmation or volume for anyone to add any sells until we see a Kumo breakout, If it breaks out we could see 135 and possibly 130 tested. Also theres news in the AM during london.
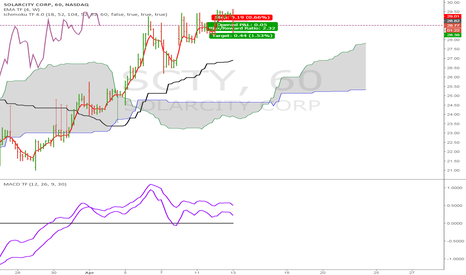
$SCTY Short on 5 min chartGoing off of the 5 minute charts.
Risk Reward 1:2,
- Entry 28.82
-Stop at Kijun-Sen 29.05
-Target 28.38
Intraday Trade. Intraday MACD < 0 and Higher Timeframe MACD turning down but still above zero
hmmwait n see ,, walaupun tenkan dan kijun sen sudah crossing tetapi harga masih belum bisa menembus Kumo ,, perhatikan pula bahwa sudah terjadi kumo twist didepan ,, jadi diprediksi Eur/Usd berganti trend menjadi bullish
Periode yang dipakai
Tenkan Sen = 8
Kijun sen = 24
senkou span = 48
Setup ini untuk menghitung rata" per 8 jam dan rata" harian :3 di h1
Catatan : crossing nya terjadi di bawah awan,,jadi ambil buy secukupnya aja atau hold sampai TK cross lagi di masa depan :3
USDCAD: Potential Cloud BreakoutWe are already long on USDCAD on break above the Blue Trendline
Wait for price to breakout of the Cloud Cumulus Formation for true bullish confirmation
Future Stratus Cloud is bullish, and turned up to the upside
Trail Stop, if entry is triggered by the Kijun-Sen
Our max stop is below previous Fractal Low
Profit Target #1 is the price touch of the GREEN Trendline
WAIT FOR CLOUD BREAKOUT (Cumulus Formation means strong possible resistence)
USDJPY 4hr Kumo-breakI took this Kumo-break trade on the 4hr chart for usd/jpy and already moved my stop-loss to break even(where the red horizontal ray is at), I will manually move my stop-loss accordingly to the Kijun Sen. I got my eyes on the monthly resistance as profit target(monthly pivot) and i set my take profit target even with last uptrend spike.
Would you still look to enter this trade¿?
You can wait until price retraces to the Kijun Sen(wich is the dark blue line btw) and when it touches it and the next candle closes above, you can then re-enter for the Possible trainride.
I will post a updated chart when this happens, beceause when pressing the play button on a published idea, indicators won't go with it and you wouldn't be able to see how it touched the Kijun Sen.(If i didn't post an update in the comment section, it didn't happen as hoped for), cheers.


