ICICI Prudential Life – Turning the Corner?After months of steady decline inside a falling channel, ICICI Prudential Life is showing early signs of reversal. The stock has recently broken out of its channel with a strong bullish weekly candle, closing at ₹571.70 with a +4.5% gain. Volume is picking up, and RSI is curling up above 40 with a bullish divergence—indicating momentum is building. Price is now near a key resistance zone (~₹590–₹610); a clean breakout here could confirm trend reversal.
📊 Financial Snapshot
Net Premium Income: ₹10,169 Cr vs ₹9,465 Cr ⬆️
PAT: ₹226 Cr vs ₹221 Cr (flat YoY)
VNB Margin: Healthy at 26.7%
Embedded Value: ₹47,020 Cr
Solvency Ratio: Strong at 211%
AUM: ₹2.88 Lakh Cr
💡 Why Consider Buying?
Reversal setup after long correction
Attractive risk-reward near base
Steady premium growth, strong solvency
Long-term growth play on India’s underpenetrated life insurance sector
🚫 Risks / Why to Wait:
Resistance at ₹590–₹610 still intact
PAT growth has been flat
Sector sentiment can be sensitive to interest rate trends
🎯 Trade Setup:
Buy Zone: ₹565–575
Target 1: ₹610
Target 2: ₹660
Stop Loss: ₹540
for educational purposes only
Lifeinsurance

GL news catalyst backside trade LONGGL fell on bad news and started its recovery in the after-market hours. The idea is on the chart.
It shows how price action can be manipulated and how retail traders can play the manipulation.

LIC India goes into a 'Wave 3' impulseThe largest insurer in India showed a massive volume and price gain on Friday's trading session bringing itself into some spot light.
The stock was in a corrective triple three structure from the start of Sep. until Nov 13 when it completed the correction with a truncated 'wave 'z''.
In a matter of only 7 trading days after having completed the correction, the stock is up 12% from bottom 'z'.
While Friday's move might make it look like the stock has over-shot a bit but in totality of things the 'wave 3' is not even half-way from its target. INR 780-790 zone is the projected wave 3 target.
It makes sense to accumulate this stock between INR 655-685 levels before it jumps above the INR 700 mark.
CMP 677
Support zone 655-660
Target 780
Note*- Please do thorough analysis of any financial instrument before you trade/invest in it. The views expressed here are my personal opinions and not an advice to buy/sell.

Aegon N.V. (AGN.as) bullish scenario:The technical figure Ascending Triangle can be found in the daily chart in the Dutch company Aegon N.V. (AGN.as ). Aegon N.V. is a Dutch multinational life insurance, pensions and asset management company headquartered in The Hague, Netherlands. As of July 21, 2020, the company had 26,000 employees. Aegon is listed on the Euronext Amsterdam and is a constituent of the AEX index. The Ascending Triangle broke through the resistance line on 22/12/2022. If the price holds above this level, you can have a possible bullish price movement with a forecast for the next 23 days towards 5.064 EUR. Your stop-loss order, according to experts, should be placed at 4.488 EUR if you decide to enter this position.
Aegon has completed two share buyback programs, one aimed at neutralizing the dilutive effect of the 2022 interim dividend paid in shares and the second to return EUR 300 million of surplus cash capital that was generated by the sale of Aegon’s Hungarian business to Vienna Insurance Group.
Risk Disclosure: Trading Foreign Exchange (Forex) and Contracts of Difference (CFD's) carries a high level of risk. By registering and signing up, any client affirms their understanding of their own personal accountability for all transactions performed within their account and recognizes the risks associated with trading on such markets and on such sites. Furthermore, one understands that the company carries zero influence over transactions, markets, and trading signals, therefore, cannot be held liable nor guarantee any profits or losses.

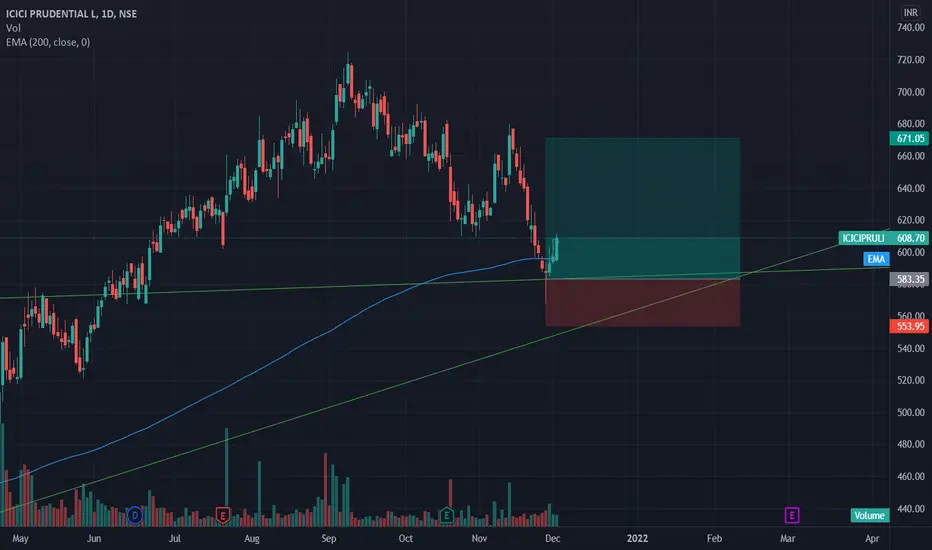
ICICI Prudential Breakout-RetestThe stock has broken out and retested, therefore it may undergo a rally. Trade is supported by brokerage calls and Supports Nearby.
Risk Reward Ratio - 3:1
SL is placed below support zone, 200 EMA & the upper trendline. The target is placed near swing high.