Long-short

ZILUSDT Daily S/R| Swing Low| Price Action| Trend Evening Traders,
Today’s analysis – ZILUSDT- trading in a strong corrective piece of price action, creating a range here at current levels can signal a potential bottom,
Points to consider,
- Price Action Corrective
- Daily S/R Support
- PSFP areas
- Daily S/R Resistance Objective
ZILUSDT’s immediate price action is corrective and is trading towards a daily level that has key previous swing lows, swing failing these lows will be a bullish sign.
The price action can range between the Bearish OB and the Daily S/R Support until the next significant expansion.
The immediate objective is the Daily S/R Resistance, this level current remains untapped.
Overall, in my opinion, ZILUSDT is a valid long with defined risk, price action is to be used upon discretion/management.
Hope this analysis helps
Thank you for following my work
And remember,
“Where you want to be is always in control, never wishing, always trading, and always first and foremost protecting your butt.” – Paul Tudor Jones

History repeating itself on Bitcoin?Before I went to sleep I was thinking about this.. before this I was hoping for a pullback to 36k area (which is almost done even in this scenario) and then downtrend to 23k.. it is also on the golden zone fibo.
Let me know what you think.

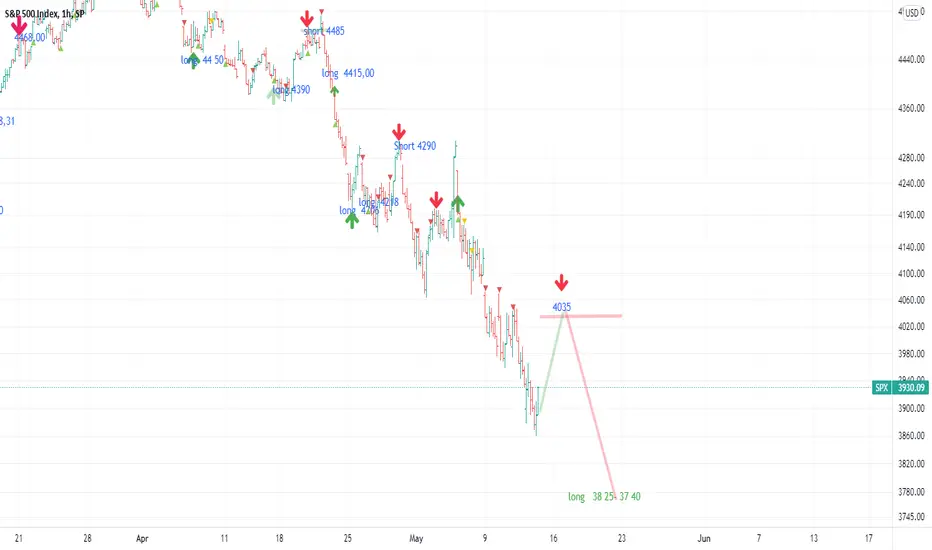
SXP 500 index: Will there be stabilization by 4030 today?Today we are here to talk about the SXP 500 index.
Today: The index is trading at 3930. In the last trading session, we saw a new bottom of the market at 3858. Since there is no profit taking in the market for players, this tells me that the stop of this fall will be at the level of 3820 - 3740.
What's on the market now:
Globally, the index goes to the level of 38 20 - 37 40
What are we waiting for today:
An attempt to stabilize the price to 40 35 and the entry of new players into the market, and then the continuation of the price movement to the level of 3820 - 37 40
What I recommend:
If you want to go short:
It is better to open short positions from the level of 40 35, limit your losses.
If you want to buy:
Long positions are possible below 3820 - 3740, limit your losses.
If you outside the market:
You can sell from 4050 or wait until the market bottoms around 3820-3740.
If you want to ask a question about an idea:
If you would like more information, please contact me in the comments below.
Also take a look at my profile for a full SPX 500 daily trading history. Contact me in 1 or 2 days for further trading advice.
Like and subscribe, thanks!
See you next time.
What I am looking to see for NASDAQ, Wed 5/11/2022We had a both way stop hunt yesterday and the price is actually ranging between the 2 lines.
I am more likely looking to BUY when I see this on chart :
will buy in case of a 4H candle close above the line, making a HH and will add with the retrace ( not risking more than I should, for sure )
SL : will be updated
TP : next zone ( 12721 )
II) I will SELL in this case
I will sell in case of a clear break below the zone with enough volume (*) and a clean retrace and break below the line making a LL.
SL : will be updated
TP : will be updated
* : Only a strong bullish or bearish candle is accepted.
CAUTION :
Trading is a game of Patience. I don't trade in ranging days and only execute when market has already decided where to go.
Please Like, Share and follow for more Ideas to come
If you have any questions let me know in comments bellow
Thanks for the support
DISCLAIMER
I am not a registered investment, legal or tax advisor or a broker/ dealer. All investment/
financial opinions expressed by me are from the personal research and my own experience
and are intended as educational material.Although best efforts are made to ensure that all
information is accurate and up to date, occasionally unintended errors and misprints may occur.

Expected Key Points Amazon 11 May 2022Amazon 11 May 2022
The current implied volatility is at 54.27%/year
So that converted into daily is 3.42%
The yesterday close price was on 2177
So based on that our
TOP 2250
BOT 2100
This channel has a 80.5% change to sustain based on the last 3006 candles
At the same time with 89% we can affirm that the price is going to be above
TOP 2185
BOT 2170
From fundamental point, today we have CPI release and this marks a huge volatility moment
From volume point, current POC is around 2170
We can expect now with close to 70% that the market is going to end up between
TOP 2185 - 2250
BOT 2100 - 2170

Expected Key Points Apple 11 May 2022Apple 11 May 2022
The current implied volatility is at 40.54%/year
So that converted into daily is 2.55%
The yesterday close price was on 154.5
So based on that our
TOP 158,5
BOT 150,5
This channel has a 79% change to sustain based on the last 3006 candles
At the same time with 89% we can affirm that the price is going to be above
TOP 154.9
BOT 154.1
From fundamental point, today we have CPI release and this marks a huge volatility moment
From volume point, current POC is around 154.37
We can expect now with close to 70% that the market is going to end up between
TOP 154.9 - 158.5
BOT 150.5 - 154.1

Expected Key Points NDX/NQ 11 May 2022NQ/ NDX 11 May 2022
The current implied volatility is at 41.43%/year
So that converted into daily is 2.62%
The opening price was on 12320
So based on that our
TOP 12650
BOT 12000
This channel has a 80% change to sustain based on the last 5394 candles
At the same time with 88% we can affirm that the price is going to be above
TOP 12360
BOT 12300
From fundamental point, today we have CPI release and this marks a huge volatility moment
From volume point, current POC is around 12410
We can expect now with close to 70% that the market is going to end up between
TOP 12350 - 12650
BOT 12000 - 12300

Expected Key Points SPX/ES 11 May 2022SPX/ES 11 May 2022
The current implied volatility is at 32.11%/year
So that converted into daily is 2.02%
The opening price was on 3991
So based on that our
TOP 4070
BOT 3910
This channel has a 87% change to sustain based on the last 1048 candles
At the same time with 85% we can affirm that the price is going to be above
TOP 4000
BOT 3980
From fundamental point, today we have CPI release and this marks a huge volatility moment
From volume point, current POC is around 4000
We can expect now with close to 74% that the market is going to end up between
TOP 4000 - 4071
BOT 3910 - 3982

BTC GOING TO 20k???BTC came to 29.2k and bounced very well from it as expected. Homever when some coin is reaching support or resistance it should be loosing momentum,but btc is gainging momentume and thats what scares the most.
BTC depends on multiple thing, one of most important things is annoucment that will take place tomorrow and its update on how goverment is fighting inflation.
If inflation is decreasing or slowing down, then btc might be at lowest point now.
But if not, all markets(stocks,crypto..) will drop fast.
If we break current support ( about 29k), I will be shorting some altcoins or maybe even bitcoin first to 20k and then if it gets broken to 12k area.
So basically tomorrows update matters much. Btc is currently in demand zone and if it gets broken we will see dump.
This is not financial advice, I am just sharing my opinion.

AUDUSD Key HTF Levels|Single Print|.618 Fibonacci|Price ActionEvening Traders,
Today’s analysis – AUDUSD – trading at a key location with bearish price action,
Points to consider,
- Price Action Corrective
- Sing Print Fill
- Weekly S/R Support
- Low Volume
Price Action is currently correction, trading at a key location where an impulsive break will lead to a the single print fill.
The weekly support is has strong confluence with the .618 Fibonacci, respecting this region will lead to an intraday price action bounce.
The current volume has climaxed, an increase in volume is needed at lower levels to indicative demand.
Overall, AUDUSD is a valid long with defined risk, price action is to be used upon discretion/management.
Hope this analysis helps
Thank you for following my work
And remember,
“All statistics have outliers. Money management, therefore, is key to the process of good trading.”
― Yvan Byeajee

BTCUSDT High Time Frame Oder Block In this section we will discuss what a price action order block is and how it is currently relevant to Bitcoin’s price action.
An Order Block is a trade location that has a cluster of price action, creating a liquidity pool. Once price action expands from the region, it automatically becomes support or resistance – hence a block,
This area once penetrated will act as a range, causing a period of price action oscillation. The Order Block can be dissected into three sections, the high (resistance), the low (support) and the middle (equilibrium). Whichever region price action breaks from will lead to a continuation or a reversal in the overall trend.
In essence, Bitcoin can remain trading in the Order Block before until decisive bottoming or continuation structures are developed.
Hope this educational peace helps!

Tier upon Tier in BTCSince 2014, we are on the top floor of a trend channel layer upon layer, breaking down will lead us to disaster... The final point is $31.780, escape without even a confirmation of the needle when it breaks.

LUNA/USDT Next Move?Hey Traders,
Brief update about our analysis
Today we are monitoring LUNA/USDT . Yesterday was very active day on the market where price fell 23%. For now LUNA is heading towards the key support level of $52. Once it's there we will get better understanding of what will be happening after that but for now this is our vision of the LUNA
If you like ideas provided by our team you can show us your support by liking and commenting.
Yours Sincerely,
Swallow Team
Disclamer:
We are not financial advisors. The content that we share on this website are for educational purposes and are our own personal opinions.

XAU/USD outlook for the weekGold is likely to continue bearish if we see a continuous rise in the dollar index(DXY)

Good and bad newsGood news! Bitcoin is going to $60K, bad news, i think is going to do it after touch the $25,600 range, when the $60K? we have to see an uptrend maybe this month and the rest of the year, finishing in december for the santa gifts.

Trading Idea - #ComcastMy trading idea for Comcast Corporation - Sell / Short
Target: 34.00 USD (+15%)
Stop: 43.00 USD
Comcast with the breakout below the descending trend channel. Double confirmation for a negative trend continuation!
Comcast Corp. is a modern communications and media company. The company is one of the largest video, high-speed Internet and telecommunications providers to residential and business customers in the United States.
Comcast delivers strong quarterly results (Q1 2022), but customer growth continues to be lacking.

Neutral outlook on the USDCADTHE USDCAD has been considerably bullish for the most part of this year and therefore you will expect overbought situations to anticipate sells with extra confirmation, however it is my view the USDCAD May continue bullish considering current price on the MONTHLY chart

ga buyga seem to be caught in a range 1.72000 & 1.79000. Both 72000 and 79000 are strong liquidity areas. price closed last week with bullish direction bouncing off 72000. that bounce created a "bank v shape b in" showing their interest in the upside and also a double bottom.

GOLD: Possible cup and handleThe situation with Gold is complicated.
It looks like a cup and handle, which does not mean that you throw you money at it going long.
This is a very wild market.
Check it out.
Disclaimer: This is not advice or encouragement to trade securities or any asset class. This is not investment advice. Chart positions shown are not suggestions intended to assure you of an advantage. No predictions and no guarantees are supplied or implied. The author trades mostly trend following set ups which have a low win rate of approximately 40%. Heavy losses can be expected if trading live accounts or investing in any asset class. Any previous advantageous performance shown in other scenarios, is not indicative of future performance. If you make decisions based on opinion expressed here or on my profile and you lose your money, kindly sue yourself.

BTCUSDT Buy or Sell, Up or Down?Guys/girls, What are we waiting for?
We are waiting for the orange color falling wedge to be broken.
It doesn't matter which direction it is. However there is more chance to continue this within the wedge for another couple of days till it comes to 35,000 -36,000.
Then it might break the wedge (Hopefully upwards but who knows?)
Anyway, I will wait till it pass 42,000 before enter. GL.

Is this a suckers rally or will there be follow through?I'm neutral on the sidelines watching this recent rally. I'm trying to decide if this is a suckers rally or will it break through resistance and test all time highs.
Notice that this entire correction was inside of a bullish wedge pattern and what we are seeing is the breakout. Generally breakouts lead to retraces, so price should come back down and test that broken trend line.
What do you think?

APEUSDT WeeklyS/R| Range POC| PA| Trend Evening Traders,
Today's analysis = APEUSDT - trading in a strong downtrend where a reversal is probable at the local trade location.
Points to consider,
- Price Action Correction
- Bullish OB Support
- POC Support
- Low Volume
- RSI Extended
APEUSDT's immediate price action is trading towards a key trade location that has technical confluence with a Bullish OB and a POC, allpowing for a bullish bias.
The immediate objective will be a reclaim of the Weekly S/R, this will signify strenght.
The current volume profile is on a decline, an influx is highly imminent on the next expansion.
overall, in my opinion, APEUSDT is a valid long with defined risk, price action is to be used upon discretion/management.
hope this analysis helps
Thank you for following my work
