$SPY Is The Sell Off Over?The above chart is a daily candle chart of the S&P 500 represented by SPY. The red arcing area is a distribution phase. The yellow highlighted area seems to be an area of indecision with both pockets of support and resistance. With in this area there's a possible "follow through day". Which, as described by Famed Technician William O'Neill is:
"A follow-through day occurs during a market correction when a major index closes significantly higher than the previous day, and in greater volume. It happens Day 4 or later of an attempted rally. Leading up to a follow-through day, an attempted rally takes place during a downtrend when a major index closes with a gain. The rally attempt continues intact as long as the index doesn't make a new low. Follow-through day variables include: an index closing sufficiently above 1% on increased volume, positive behavior of leading stocks, and improved market action regarding support vs. resistance levels. The most powerful follow-through days often happen Day 4 through Day 7 of an attempted rally. In the wake of a follow-through day, the market should continue to add gains in strong volume, with breakouts by top stocks. This is further confirmation a new uptrend is underway."
Do we fit the criteria of a follow through day?
1) Did we have a market correction?
Peak-to-trough was a roughly 12% drop.
2) Was there an attempted rally?
January 24th saw a 4% plus drop only to close higher on the day. That low has proven to be the low of the sell off thus far.
3) Was there a higher close on strong volume on day 4 or later?
On the fourth day, the index closed 2.5% higher then the previous days close on stronger volume.
4) Did the rally continue on strong volume?
Today, the fifth day, saw the index rally back above the 200 Day Moving Average for a nearly 2% gain and on above average volume.
5) Did leading stocks breakout?
The rally was lead by tech stocks and with in the group semi's such as NVDA and AMD lead the way.
The argument for a follow through day seems pretty persuasive.
What does the community think? Too soon?
Long-short

AMD GAMEPLAN - JANUARY 31-FEBRUARY 4This AMD plan shows possible trade ideas for longs and shorts.
-Currently, AMD has had a double bottom of sorts, and passed the previous swing high with ease.
-The price still falls below the Anchored VWAPs and below the highest volume by price range (112)
-Strongest buying pressure in recent times
-Passed above the 50EMA with ease
-MACD looks strong on 1hr
Also hit a strong Fib support off of 99.00

Bitcoin 4h between MA 100 & Up the Weekly Pivot LineLooking at the MACD, we can see a hidden divergence pattern from 33800 to 38400 and the RSI hasn't reached it's critical overbought point over 70 yet and currently is at 59
the price has overcome Weekly PIV Line,though looking at the MA 100, it serves as a strong resistance line at 38700
if candle closes above 38700 we can expect the next resistance at 40900
if candle closes below 38700 then we can expect a support at 37200

FTMUSDT Price Action OB| Double Bottom| Low Volume| Trend Evening Traders,
Today’s analysis – FTMUSDT – trading action trade a t a key trade location where a bounce is probable,
Points t consider,
- Price action corrective
- Local OB Support
(Double Bottom Confluence)
- Volume Low
- Trend Corrective
FTMUSDT’s immediate price action is trading inside an order block where a bounce will confirm a double bottom, allowing for a bullish bias.
The current volume profile is below average, an influx is highly imminent on the next expansion.
The current trend is corrective, thus any rallies are likely to be sold into.
Overall, in my opinion, FTMUSDT is a valid long with defined risk, price action is to be used upon discretion/ management.
Hope this analysis helps,
Thank you for following my work
And remember,
Timing, perseverance, and ten years of trying will eventually make you look like an overnight success. – Biz Stone

KCS all 3 possible moves hello everybody
these are 3 possible moves
green : squeezing price below the trendline and breaking it. ( personally, I will wait for 18 $ resistance to break ) ( don't forget to wait for retest).
yellow : relow at 15 $ support line then break the trendline. ( I will buy after retesting the trend )
red : losing the 15 $ support and retesting it.
......
this is another trade for now and a little risky.
the first target is touching the trend
sec target losing the trend and it is 15 $
not financial advice.
goodluck

EURUSD Local OB| SFP| POC| Swing High Evening Traders,
Today’s analysis – EURUSD- trading at a key support level that needs to hold for a bullish bias,
Points to consider,
- Price Action Impulsive
- Local OB Support
- Potential Swing Failure
- Swing High Objective
EURUSD’s immediate price action is trading at a key trade location that has technical confluence with the Local OB and the SFP, allowing for a bullish bias.
The immediate objective is the Swing High, exceeding this level will lead to a trend continuation.
The RSI is overextended; a reversion to its mean is imminent on a bounce back.
Overall, in my opinion, EURUSD is a valid long with defined risk, price action is to be used upon discretion/ management.
Hope this analysis helps,
Thank you for following my work,
And remember,
“A quiet mind is able to hear intuition over fear.”
― Yvan Byeajee

#BTC what will happen ? Scenario 1
Breakout from Demand Zone
Target +$50K
Scenario 2
Rejection from Demand Zone
Target -$30K
Witch scenario looks more to happen from your point of view ?


USD/ZAR PossibilitiesThe Rand ran it up the past few days, A few doji's before and during the rally are signs of it getting weaker. So Price can either nearly touch descending trend zone, or bounce down & continue. All in all I'll be watching diligently for some solid confirmation in candle play around these zones. What are your thoughts?

LINKUSDT Daily S/R| Local OB| Price Actin| Trend Evening Traders,
Today’s analysis – LINKUSDT – trading at a key level where a respect can lead to a bounce,
Points to consider,
- Price Action Impulsive
- Daily S/R Support
- Local OB Resistance
- RSI Extended
- Low Volume
LINKUSDT’s immediate price action is trading towards a key Daily S/R level, holding this level allows for a bullish bias into the Local OB.
The RSI is currently overextended, a reversion to its mean is probable from region, epicially with price action finding support.
The current volume profile is below average, an influx is highly imminent on the next expansion.
Overall, in my opinion, LINKUSDT is a valid long with defined risk, price action is to be used upon discretion/ management.
Hope this analysis helps
Thank you for following my work
And remember,
“Sheer will and determination is no substitute for something that actually works.” – Jason Klatt

AAPL shortWith the US stock market appearing to be in a pullback, there are plenty of reasons to be bearish right now.
Based solely on TECHNICAL ANALYSIS, I remain bearish. AAPL is showing a clear head and shoulders bear pattern. Head and shoulders is, in my opinion, one of the most reliable price movement indicators.
Just speculation (:

GBPAUD Local OB Resistance| Swing Failure| Price Action| Trend Evening Traders,
Today’s analysis – GBPAUD – trading at a key trade location where a rejection is probable,
Points to consider,
- Price Action Impulsive
- Local OB Resistance
- Price Action Swing Failure
- Low Volume
- Trend
GBPAUD’s immediate price action is trading at an order block resistance that is in confluence with a Swing Failure Pattern, allowing for a bearish bias.
The current volume profile is below average, an influx is imminent open an expansion.
The current trend is corrective, thus a rejection here will establish a technical lower high.
Overall, in my opinion, GBPAUD is a valid short with defined risk, price action is to be used upon discretion/ management.
Hope this analysis helps,
Thank you for following my work
And remember,
“In order to succeed, you first have to be willing to experience failure.”
― Yvan Byeajee,

BITCOIN , BTCUSDT 1DBitcoin ♻️
Bitcoin jumped up after the support test of 32900 and was able to move up to 38500
But this does not seem to be the end of the downtrend, and the pullback to the lost level was probably $ 39000- 40000$ , According to the ABC model, which was analyzed 4 days ago, the level of 29000-30000$ not been tested yet and the cycle has not been completed⚠️
Bitcoin needs at least a few strong 4-hour candlesticks with a high volume, over 40000$ , to climb and end the correction and downtrend.
But tonight, after the Federal Reserve meeting and the release of economic statistics and a statement on digital currencies, we can better understand the market decision and trends ❗️
➖➖➖➖➖➖
❤️ If you apperciate my work , Please like and comment , It Keeps me motivated to do better ❤️
👤 Saeid.Mahbob
📅 01.26.2022

RUNEUSDT Daily S/R| Price Action| Double Bottom| Volume Evening Traders,
Today’s analysis – RUNEUSDT – trading at a key trade location that is likely to hold,
Points to consider,
- Price Action Corrective
- Daily S/R Support
(Double Bottom Confluence)
- Local OB Objective
- RSI Extended
RUNEUSDT’s immediate price action is trading at a key trade location that has technical confluence with the Daily S/R and an Order Block, allowing for a bullish bias.
The Local OB is the immediate objective, exceeding this level will lead to a trend continuation.
The current RSI is overextended, a reversion to its mean is probable on a bounce back.
Overall, in my opinion, RUNEUSDT is a valid long with defined risk, price action is to be used upon discretion/ management.
Hope this analysis helps,
Thank you for following my work
And remember,
“Genuine acceptance that there will be losses on your way to market success will greatly decrease the hurt when they eventually come.” ― yvan Byeajee

BTCUSDT Update - First $43000 then $26000?Hello trader, today we will talk about bitcoin
Let's start with the fact that we warned about such a decline to 35000, we warned that there would be an impulse price decline
and also that only a few guys can and can short this market.
You can find these posts in our....
Now our team of analysts is disassembling this tool for one purpose
Having analyzed Bitcoin on all timeframes, we assume (this is not financial advice) to open positions against the current of the market (open long positions)
Why ?
The Internet began to discuss the price drop to 20,000
Yes, this is logical - uh, this is a very likely scenario.
But
We broke the level of the Head and Shoulders pattern - where the price DON'T returned to the level of 43000 (did not happen)
The second factor is that the cluster analysis indicates increased volumes in the delta. (buy)
The third is psychology (Most traders and small speculators are already accustomed to falling) and set short stop losses at 1-2% of the entry into their short positions.
Thus, the market can grow impulsively due to the same stop losses.
The fourth factor is that the price has covered one of the big gap formations (in short, the price gap has been filled)
The fifth factor is the narrow channel in which the price is located.
The sixth factor is the fear in the market to miss the bottom of the market, everyone wants to buy cheaper.
But lost profits will be bought at 43,000 - where the market will be lowered even lower.
Given the non-recoiling fall, we expect the release of one good news where the entire market will be raised by several hundred billion dollars
Also considering all target CMEs on the exchange
our team expects this outcome.

XAUUSD TRxauusd is in a beautiful trading range in 5m and 15m you can long at the bottom of the tr and short at top of the tr , until its breaks , and then you have must to trade in break side

NZDJPY Local OB| Swing Low| Price Action| Trend Evening Traders,
Today’s analysis – NZDJPY- trading at a ley trade location where a bounce is probable,
Points to consider,
- Price Action Corrective
- Local OB Support
- Daily S/R Objective
- RSI Extended
- Declining Volume
NZDJPY’s immediate price action is trading at an area that is in confluence with an order block and a potential swing failure, allowing for a bullish bias.
The Daily S/R is the immediate objective, exceeding this level will lead to a trend continuation.
The current RSI is overextended, a reversion back to its mean will happen on the price action rise.
Overall, in my opinion, NZDJPY is a valid long with defined risk, price action is to be used upon discretion/ management.
Hope this analysis helps,
Thank you for following my work
And remember,
“Trading effectively is about assessing probabilities, not certainties.”
― Yvan Byeajee

USDJPY @RESISTANCE of WEEKLY RANGE - REVERSAL? [240122]
Good Evening People...
Tonight, I will be providing Technical Analysis for the USDJPY
Reasons being - This particular currency pair looks have approached a major weekly level
So, Lets get stuck in...
As always, I will kick off with the ' Top-Down' Analysis
Looking at the Monthly Timeframe - We can see that back in April '21 there was a breakout of a 4 year Descending Channel
Following this, the market proceeded to print Higher Highs/Lows
With this in mind - Yes, we are looking for Long Opportunities
But, not before moving down to the Weekly Timeframe
On the Weekly - I have marked out a long term Range
What caught my attention is - Over the last month, Price has tested the Resistance of this Range and began to travel south
Furthermore, the market may be forming a Head & Shoulders Pattern
We have the Left Shoulder & The Head completed - With Price heading towards the partial formed Neckline
So, are we looking at the beginning of a Reversal in the market?
After studying the Daily Timeframe - An Ascending Channel was identified
At the Support of this Channel [Where it looks like the market is currently heading - We have Confluence with this Channel Support & Horizontal Support @112.72
Additionally, the neckline of the potential H&S on the Weekly coincides with this zone for further Confluence
For me, this is the zone where trade decisions can be made
Personally, I will be looking for Price Action in the form of a Candle Stick for Buys
Alternatively, a Daily close below the confluence @112.72 would have me considering Selling opportunities
Updates will follow - When the time is right
Well, that's all for this evening folks...
Thanks for tuning in & Stay Cool

EURNZD - Sell Zone EURNZD - Sell Zone
EURNZD - Sell Zone
EURNZD - Sell Zone
EURNZD - Sell Zone
EURNZD - Sell Zone
.....................
Tlg: its_marshall

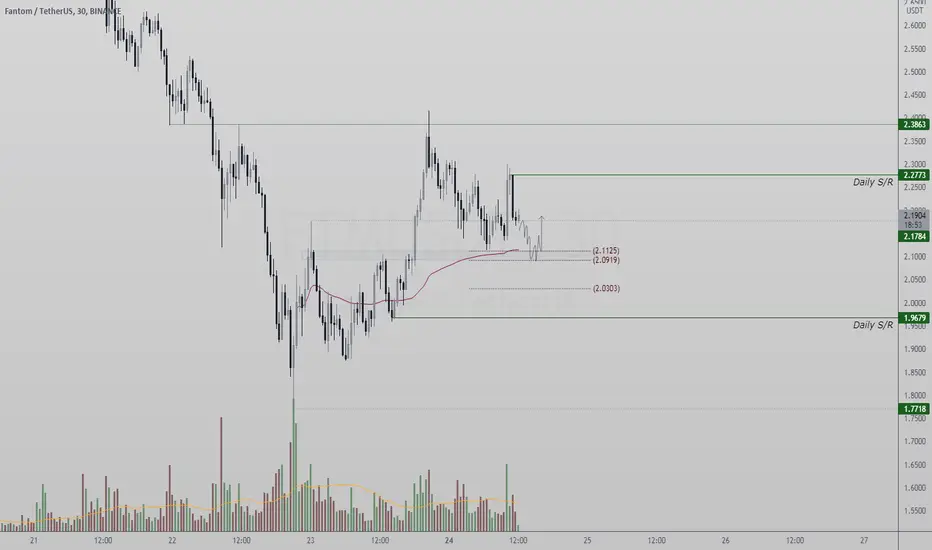
FTMUSDT Daily S/R| .618 Fibonacci| Price Action| Trend Evening Traders,
Today’s analysis – FTMUSDT – trading towards a key trade location where a bounce is probable,
Points to consider,
- Price Action Impulsive
- .618 Fibonacci Support
- Daily S/R Objective
- Low Volume
- Trend
FTMUSDT’s immediate price action is impulsive and is trading towards a key location that has technical confluence with the .618 Fibonacci and the Local OB, allowing for a bullish bias.
The Daily S/R is the current objective, exceeding this level will lead to a trend continuation.
The current volume is below average, an influx is highly imminent on the next expansion.
Overall, in my opinion, FTMUSDT is a valid long with defined risk, price action is to be used upon discretion/ management.
Hope this analysis helps,
Thank you for following my work
And remember,
“You create your own game in your mind based on your beliefs, intents, perception and rules.”
― Mark Douglas
S&P 500 Correction Imminent ???I enjoy long term charts. It allows me to drown out the noise and find the signal. I find this chart interesting. What we're looking at is a monthly candle chart of the S&P 500 SP:SPX The moving averages used are 10 month MA and 24 month MA. Looking at a chart since 1995 the index has closed below the 10 month MA a total of 13 times. 10 of the 13 times the index preceded to test or close below the 24 month moving average.
It could be coincidental but I find that correlation interesting. If January closes below the 10 month MA then there's about a 77% chance of trading down to the 24 month MA. (Assuming the correlation is valid) Considering how far above the 24 month MA the index is currently trading the decline could be sizeable. That would represent another 14% drop from where the index currently sits and it would be about 20% from the high.
Coincidence?

EURJPY bearish!eur jpy is bearish and I would love to look for shorts but if you want to you can look for longs but keep in mind its risky.
this is no financial advice!
if you want a higher timeframe analysis let me know

ONEUSDT Daily S/R| Range High| Price Action| Trend Evening Traders,
Today’s analysis – ONEUSDT- trading at a key trade location where a reversal is probable,
Points to consider,
- Price Action Corrective
- Daily S/R Resistance
- Single Print Fill
- Local OB
- .618 Fibonacci Support
ONEUSDT’s immediate price action is corrective and is trading at a key location that has technical confluence with the Daily S/R and Single Print, allowing for a bearish bias.
The immediate objective is the Local B, exceeding this level will lead to a bearish trend continuation.
Price action is currently range bunce, accumulation is imminent before the next expansion.
Overall, in my opinion, NEUSDT is a valid short with defined risk, price action is to be used upon discretion/ management.
Hope this analysis helps,
Thank you for following my work
And remember,
“You’re going to learn a million things, then you need to forget them all and focus on one.” - SunriseTrader
