The Euro Dollar**Welcome, first I want to personally thank you for taking you time to read what I am about to share with you. These ideas I am publishing come from my view of the market as any other trade influencer out there. It's important to understand that as humans, we possess the possibility of sharing information, and are known to adapt to correct feedbacks of information and disregard what we perceive as being false/wrong information. I want to begin with this fact. The market is designed for neither of you or me to be right or wrong. The market is designed to move money from one source to another. That's all. There is nothing more to that fact. Understand this fact at it is vital for this publication.**
The Euro Dollar has been on a downtrend, 4H chart, since July 13. Although many attempts have been seen throughout the last couple of weeks of bullish pressure entering the market in an attempt to rebound prices. They, unfortunately, have failed. This is obvious. Without looking at indicators, take a shot at the 4H chart on the EUR USD. What do you see? The correct answer is what I just have mentioned. Now, this is nothing I have made up or predicted, however, everyone in the whole wide world who has access to a 4H chart can clear as day see this downtrend (As suppose you are right now). But this downtrend is subject to reversal! I know some of you may be thinking just that, however, and hear me out. How certain are you that the price will reverse just because an indicator is advising you it will? Are you sure you are using the indicator in a correctness. Well, for starts, an indicator can only provide you information on what others are doing, and not where the market is actually going.
Yeah I know, it sucks. Well its the truth. I'm not saying use or don't use them, I'm just advising you of the fact, just like you can see the downtrend on the 4H. And the fact is that INDICATORS CAN NOT show you where the market is going. If they did, well... they'd all work. Period.
What I can tell you is, is that the market itself is telling you what its doing. The market is going down, bottom, low, whatever you want to call it but its doing this ( \ ) not ( / ). Those are suppose to be trend lines, I know terrible. Anyhow, the MARKET is telling you what to do. Its telling you hey bud I'm going down, whether you like it or not, its going DOWN! Now it may choose to go up tomorrow, or in the next couple of weeks, and that's cool and all because good traders would at that point cut their losses and follow the trend upwards, assuming they haven't opened a YOLO 100X margin trade on a $300 account.
See. Its really that simple. Market tells you its going down, you go with it, obviously protecting yourself from when it decides to go back up and vice versa. I hope you found this simple idea with meaning, because honestly, the markets are that simple. You can only BUY or SELL, don't over complicate that fact as a retail trader.
Good Luck
HAPPY HUNTING
Long-short

Gold back to 1927?Tap and respect in my FVG on LTF. Watching to see if we see a push back up to the 1827 resistance area. This is a strong high so i doubt the break, but definitely a re test. Gold 4Hr support around 1815-16 area, Weak low so after a touch of 27 i will target 16.

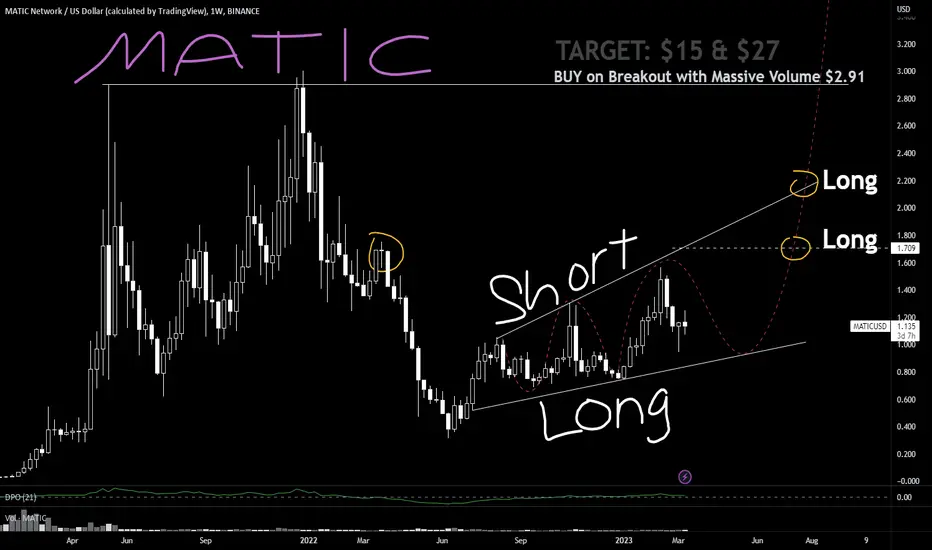
MATiC: Long Short PLAYBOOK
Indians love to churn businesses
so do projects with EXCELLENT marketing
as evident in MATiC price action anchored to series of camaigns
from Name Change POLYGON to recent zkEVM March rollout
Gang of 8 Whales control the Price
and looks like it loves to hunt stops in between the cost of HANDLER
Asian Market handler in control
Euro Market free for all organic market decides
US new york .. handler decides on news event driven anchored to BTC and DXY
Body Clock of Handler is it hunts liquidity at obvious floor ceiling beyond it
notice the TRUMPET formation
size you entry and Churn Milk this with the King of Japipur
NOTE:
do not use Logarithmic scale as it fools or tricks your eyes
stick to normal chart
that harami circled doji in Yello is an indecision or unfinished business of TRADE
to be revisited
EURGBP - Long/Short Scenario (ICT)Long and short scenario for EURGBP.
Scenario (A) is relying on a reversal from a Bullish 4h Breaker Block before moving higher.
Scenario (B) is relying on a retracement from a Bullish 4h Breaker Block up into a Bearish 4h Breaker Block before moving lower.

BTC - Don't believe the hype just yetBTC reacted to the news of the Grayscale ETF being approved with a 6ish % pump, this has gotten a lot of people speaking about new highs and finally a break above the 31k level.
However, BTC broke its bullish trend and it's current pump is only resulting in the development of bearish diversion with an already apparent decrease in volume.
We are also in the middle of a range, and like I've said before, to really be bullish we want to be above the 28,800 level, which we are currently below of.
For now I am watching the price action, however, my expectations are for a lower high to be set in before a lower low, this could also shape up to be a H&S with a neckline at 25ish k.
So for now:
WAIT FOR KEY LEVELS AND MORE PA TO SUGGEST A KEY DIRECTION, HOWEVER PA SUGGESTS MORE DOWNSIDE.

Sentiment changed. Gold will be bullish first then fall backYesterday was a rough day. Gold managed to spike beyond the daily Channel(resistance) In my opinion manipulation occurd to wipe Sellers. Gold eventually fell back around 250pips. GOld is currently floating above support level. I think gold will climb first test the last high again around 1945 And fall from here. But there is still a untouched area around 1953 were the posibility is for gold to take orders first.
For now it is good to go long first around 1920-1925. And short 1945 or 1953. Best thing is to wait for price reversal patterns. This way we don't get wipped.

FOMC Order And PredictionTargeting sells from 1944-46 area. Golds sudden bullish movement to this price has caught my eye. I believe FOMC will not raise rates, thus I think it will have a huge impact on metals. There could be range up to that 1948, my stop is at 1948.5 with 2 targets 1940 and 1927 which was around the area of 25 key support.
Ive implemented the use of FVG, BOS and CHoCH, Im slightly adjusting the way I trade news, and trying to play it safer with setting orders rather than instant executions.
Overall this trade gives me a 1:1, 1:3.75 R/R. Orders set, lets see how my analysis goes.

18/09/23 Weekly outlookLast weeks high: $26894.1
Last weeks low: $25873.8
Midpoint: $24853.5
After CPI and PPI news events that took place last week, we can see a clear uptrend after a deviation below the midpoint, then a reclaim and a move up higher.
This week we have FOMC and the interest rate decision. The forecast is for the interest rate to remain the same at 5.50%. This decision has been priced in IMO but that doesn't rule out any potential whipsawing in the minutes up to and following the decision, we also have the press conference that can give some volatility too. However, if last weeks news events are anything to go by the volatility will be low compared to previous FOMC's.
The bigger picture plan stays the same for me, I do think we're moving towards that yearly open retest before thinking about the run up to the halving and the bullrun beyond. A retest of 28k resistance with a bearish reaction off that level would further add confluence to this idea. As for now staying patient and looking for opportunities outside of the choppy price action.

XAU/USD 11.09.2023 long or shortFOREXCOM:XAUUSD
Hello traders,
Today, I'm focusing on two potential trade scenarios. First, a bearish trade would be considered if we can remain below the resistance line. In this case, the stop-loss would be positioned somewhere above 1930.
Alternatively, if we can't sustain below the resistance line, I would be looking for bullish opportunities. In such a scenario, I'd search for retest trades in the area around 1928, with the take-profit target set up to the white market areas.
Please keep a close eye on the market and execute these trades based on the current conditions and price action.

UBER: $43.60 | Sniper Mode handler is setting up for a short with rejection above 44 levels at the same can be shaken down for accommodating a WHALE whod like a big position towards $100 levels'
either way for LEVERAGE players with 10x to 50x stake.. a wait and FIRE moves should provide a decent reward...
Finger on the trigger folks...

Bitcoin long : 2 targets.First target 27k and second target 28k.
I think 27k is easier to catch , but if anything drastic happens in the markets 28k should be considered as a good option.
Use proper risk management . Longing at these levels is risky.Overall my bias stands for more downside. I just like the setup and i think its worth taking the risk ,if btc goes down i still make money , i still have short positions opened from 30400$ region.

TRADE TODAY 6:1 (result)BYBIT:AUCTIONUSDT.P
Auction enters my preferred liquid zone where I will scalp a 6:1 on the 15 minute chart
DM for free lessons.
NO BS

04/09/23 Weekly outlookLast weeks high: $28152.7
Last weeks low: $26737.6
Midpoint: $25322.5
When compared to last weeks outlook, we had what basically looked like a heartbeat monitor in price action. A flatline with a big pulse in the middle of the week from the midpoint then to weekly low, then high then straight back to the midpoint.
Now when looking at the previous weeks price action it's very similar only the price action is hugging the 0.25 line before a huge pump on the news of the Greyscale win against the SEC, we fully retraced and some to print the low of the week.
From a macro perspective, I am still bearish for the time being until proven otherwise, that would be if we finally take out 32.5k convincingly. On the higher time frames we have a lower high and lower low structure, textbook bearish. Not only that, what worries me is how quickly we are retracing good news pumps. Big money seems to lack conviction at this point so for now pumps are for fading. I still think we see 19K again by the end of the year.
September follows a similar historical return as August, generally negative when not in a bullrun year. For now I'm just monitoring, If I'm looking to go short I would do so on a swing fail pattern of the midpoint.

NFP PredictionXAUUSD has had a nice pump recently, looking at previous data, I can see that +12K is forecast for this months NFP. This should boost the Dollar. While dropping gold and other pairs. Ive entered Sells around NY opening, will hold through NFP with a bigger than usual SL. Time will tell, always use risk management, and extra caution when trading news. Its unpredictable and can be risky.

xauusd gold daily analysisHello everyone, looking at the daily timeframe we can see gold has picked up volatility below 1890 with a strong rejection back into the 1900's
Should we see price hold and not reject key levels of resistance, expectation will be for gold to return to the range we have previous seen gold stuck within, with a push to 2000 creating a top wick for the monthly candle and then a move down.

21/08/23 Weekly outlookLast weeks high: $29678.9
Last weeks low: $26943.6
Midpoint: $24208.4
August so far has been living up to it's history of being a red month. Last week we saw price fall ~18.45% from weekly high to low, filling in the fair value gaps from the previous HTF rally and printing a new 1W lower high for the first time this year.
Now that the FVG has been filled and a bit of volatility reintroduced into the market the next move is very important. For BTC to stand a chance in the near term I think the bulls need to reclaim the 1D 200EMA very quickly. Last weeks midpoint at 26942.4 is also approximately at the 1D 200EMA. However, If price rejects off that level when retesting it then I do think price will slowly find itself tending towards the yearly open of around 19k.

A 80% edge - Mostly unused. Why?The Medianline/Pitchfork Tool provides a high probability (~80%) to reach the Centerline from any parallel line.
That means, if you can figure out how to buy as low as possible, or short as high as possible, your trade works out ~80% of time.
Why would one not use this edge?
Ask me questions, I'l answer.

USDCHF LongsLooking to buy from the support level of 0.87240,
waiting for that pull back before we enter just to add extra confirmation

CHFJPY Short setup with entry point!Good morning traders, I was analyzing CHF/JPY, one of the few pairs I'll be observing today, given the expected data on the Canadian and American dollars. This asset currently presents a bullish setup with good potential for a bearish reversal. Currently, it's at the level of 165.65, supported by demand + thirty levels. Personally, before entering long positions, I'll wait for a significant retracement to the level of 163.80, where we have a Breaker Block on the M15 timeframe. If the price reaches this level with an M15 candle showing no pin, no doji, and with volatility lower than 10 pips, we could consider a long entry. Of course, as the initial confirmation of a descent towards our entry zone, the market will need to confirm with breaks on the M15-H1-H4 of the Swing Low on the H4 timeframe at the level of 164.86. Let me know what you think, comment, and leave a like to support the hard work. Happy trading to everyone.

EURNZD 13/8/23EN giving us an untradeable range here for a bullish move higher, not for what we have we will simply wait for a break as our overall bias is unclear, we did have a signal on Friday for possible downside so we will keep this in mind coming into this week, if our London open gives us a sort bias again we will look to follow that for our first entry of the week. until then we need a clear break out of our range.
Remember to always read order flow and follow what price is showing you instead of trading based on your desired direction. And, as always, stick to your risk and your plan.
We'll be closely monitoring market openings and price action throughout the week. If you find this analysis useful, let us know in the comments below and hit the boost button to show your support. Here's to a successful week of trading!

1 MILLION DOLLARSHello Everyone, MrBanker is here. This is a stock-to-flow analysis for Bitcoin. This model incorporates the relationship between the circulationg supply and the total number of mined bitcoin on that particular year.
This theory has been proved to be true during the life span of bitcoin. Accordingly, It is expected for the price to reach 1 Million $ starting from early 2024.
However, the possibility for this outcome might be seen in the late 2028 as well.
If you want to become a millionere without a doubt, just but 1 BTC.
Trade Safe,
MrBanker

XAUUSD Gold 1 hour breakdownLooking at the 1 hour time frame, we are right at a support level. Sells were taken all day today, 3 in total, 2 being in profit with 1 in breakeven. Bias remains somewhat bearish however we must pay attention to what price can do at these levels of interest where price in the past has been finding it challenging to get through.
short term bias is bullish, long term bearish.

USDJPY 24th july US dollar to the Japanese yen gave us a pretty similar scenario to the British pounds of the Japanese yen we broke bullish providing a huge range powered by news and fundamentals we now have located the lowest half of the range with our unmitigated order block we are looking for price to run back to this order block and continue pushing higher. Based off of the price action we have seen in Monday's session I am not expecting this to pull back to our poi I am expecting this to run the high though and continue moving higher.
Remember to always read order flow and follow what price is showing you instead of trading based on your desired direction. And, as always, stick to your risk and your plan.
We'll be closely monitoring market openings and price action throughout the week. If you find this analysis useful, let us know in the comments below and hit the boost button to show your support. Here's to a successful week of trading!
