Nifty Parallel Channel and how things are shaping up. Nifty has closed strongly above the Mother line of Weekly chart this week. This should be considered a solid come back by Indian markets after the Trump Tariff induced fall. Indian economy is showing it's capability to bounce back on the back of strong rally in most of the sectors other than IT. Uncertainty in IT still looms as below par results that have started coming for might TCS and INfosys. We have a long weekend and uncertainties due to various announcements by global leaders regarding Tariffs can still spoil the party so one needs to be cautious in carrying huge positions over night and over the week especially in F&O trades.
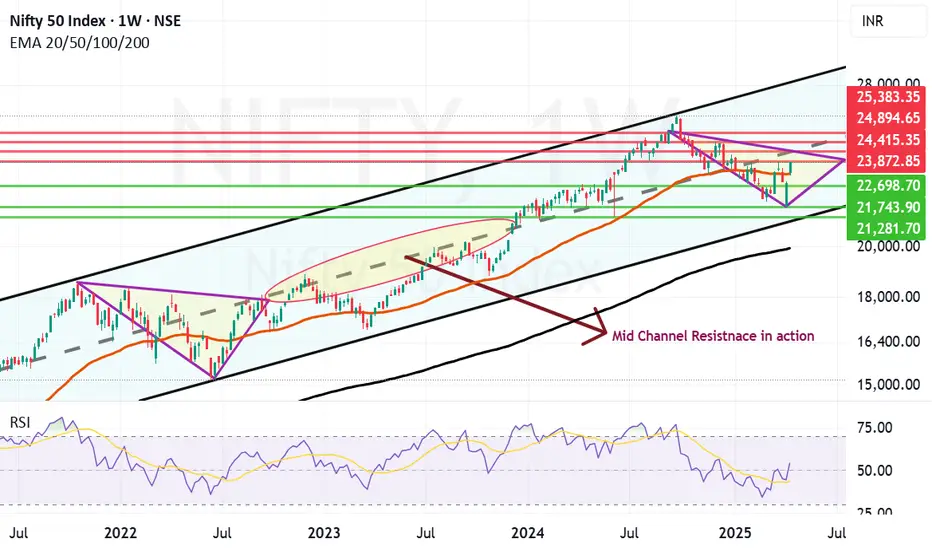
Nifty travelling in a Parallel channel depicted above since 2020 is just below its Mid channel resistance at 24415. If you want to see the power of Mid Channel resistnace look at how it stopped Nifty between August 22 to December 23 below it. So Mid-channel resistnace should never be taken lightly. The area is depicted in the chart for your better understanding. Even before we reach that point of major resistance, Nifty has to counter strong resistance which was high of today and this week at 23872. Closing above 24415 can enable and empower Bulls to further push Nifty towards 24894, 25K and 25383 levels if the rally continues.
To know more about Parallel channel and how this Technical tool can be used to create wealth in stock market , you need to read my book The Happy Candles Way To Wealth creation. It is a highly rated book have a look at various reviews of the readers on Amazon. Both paperback and Kindle versions of the same are available on Amazon.
Nifty supports in case it is not able to cross and close above the resistnace zone of 23872 and 24415 will be 23272 (Strong Mother Line Weekly Support or 50 Weeks EMA) and 22698. A closing below 22698 in case of some adverse news or global development can empower the bears and can have potential to drag Nifty towards recent low of 21743 or 52 week low of 21281.
As of now things looking good but we have to wait and see the global and local developments over the weekend.
Disclaimer: The above information is provided for educational purpose, analysis and paper trading only. Please don't treat this as a buy or sell recommendation for the stock or index. The Techno-Funda analysis is based on data that is more than 3 months old. Supports and Resistances are determined by historic past peaks and Valley in the chart. Many other indicators and patterns like EMA, RSI, MACD, Volumes, Fibonacci, parallel channel etc. use historic data which is 3 months or older cyclical points. There is no guarantee they will work in future as markets are highly volatile and swings in prices are also due to macro and micro factors based on actions taken by the company as well as region and global events. Equity investment is subject to risks. I or my clients or family members might have positions in the stocks that we mention in our educational posts. We will not be responsible for any Profit or loss that may occur due to any financial decision taken based on any data provided in this message. Do consult your investment advisor before taking any financial decisions. Stop losses should be an important part of any investment in equity.