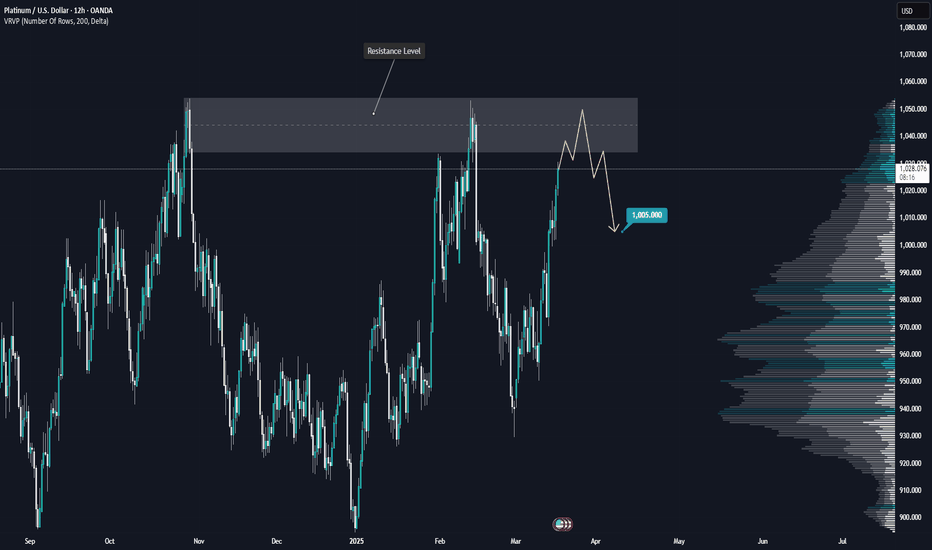
PLATINUM Approaching Key Resistance – Potential Reversal?OANDA:XPTUSD is approaching a significant resistance zone, marked by previous price rejections and strong selling pressure. This level has historically acted as a key supply zone, making it a critical area to watch for potential bearish reactions.
The recent bullish momentum has brought price back into this resistance, increasing the likelihood of a pullback if sellers regain control. If rejection is confirmed within this zone, we could see a move lower toward the $1,005 level, aligning with a corrective move after the recent rally. However, a strong breakout above this resistance would invalidate the bearish bias and could lead to further upside.
Traders should watch for bearish confirmation signals, such as rejection wicks, a bearish engulfing pattern, or increasing selling volume, before considering short positions.
Let me know your thoughts or any additional insights you might have!
Platinumanalysis
Platinum: How low will you go? 🤔Platinum is on its way downwards to develop wave Y in light green and still has got room to expand. Indeed, there is a 30% chance that the price could even drop into the green zone between $758 and $659, establishing the low of wave Alt.Y in light green instead. Primarily, though, we expect platinum to turn upwards before reaching the green zone.
Platinum USD long 1D Time Frame The trend of Platinum USD on the 1D time frame is showing a reversal. Firstly you can see a downtrend in the form of LH and LL then at the bottom, you can observe the HH and HL which is a sign of trend reversal or consolidation phase. So you can buy from here by putting a stop loss at the LL point mentioned in the chart.
Platinum: 1D Chart ReviewHello friends, today you can review the technical analysis idea on a 1D linear scale chart for Platinum.
The chart is self-explanatory. Platinum price made multiple attempts to get back above the 0.618 Fibonacci Retracement level but was rejected and now headed back down. Platinum price may be supported by the Multi-month support line. If it fails there then expect price to head to the 0.382 Fibonacci Retracement area. RSI just broke below a multi-month S/R line, which is not a good sign.
If you enjoy my ideas, feel free to like it and drop in a comment. I love reading your comments below.
Disclosure: This is just my opinion and not any type of financial advice. I enjoy charting and discussing technical analysis. Don't trade based on my advice. Do your own research! #cryptopickk


