Post-Report Sell-Off Seen as UnwarrantedSupporting Arguments
The market's reaction to the Q1 report was excessively negative
The stock possesses fundamental upside potential driven by a high revenue growth rate
The technical analysis indicates a probable rebound
Investment Thesis
GeneDx (WGS) specializes in delivering precise medical diagnostic results, leveraging exome and genomic testing to accurately diagnose genetic disorders. The company exclusively generates its revenue within the United States.
The recent GeneDx report significantly exceeded market expectations, yet the market's reaction was starkly negative. In our assessment, this presents a promising acquisition opportunity for WGS. Revenue for the first quarter of 2025 surpassed consensus estimates by 9.6%, also resulting in a substantial positive EPS surprise. The company has revised its full-year 2025 revenue guidance upwards by a median of $12.5 million, now projecting between $360 million and $375 million. This adjustment accounts for an anticipated $3 million to $5 million in revenue from the prospective acquisition of Fabric Genomics. The net increase in the guidance aligns closely with the value realized from the first-quarter surprise.
The only potentially contentious aspect of the report is the recorded 0.5% q/q decline in testing volumes within the largest revenue-generating segment, exome and genome sequencing. This trend has not been observed in this segment before. However, a seasonal dip in Q1 testing volumes is typical within the laboratory industry. This decline is primarily driven by a reduced number of working days in the first quarter and heightened diagnostic demand in Q4, as patients seek to maximize their insurance benefits before year-end. Historically, the low base effect coupled with GeneDx's robust sequential growth has counterbalanced unfavorable seasonal trends in Q1. Additionally, in the latest quarter, management cited the California wildfires as a possible negative influence on testing volumes. Consequently, we believe this testing dynamic does not warrant the marked downtrend seen in the price of WGS, especially given the upgraded guidance and the expansion of the product portfolio, both of which are poised to drive revenue growth over the next three years.
WGS stock is fundamentally undervalued. The GeneDx peer group has maintained a trading average of a 6.8 EV/Sales multiple over the past three years. We regard this figure as an appropriate target for GeneDx. Presently, the 2026 EV/Sales multiple stands at 5.6. We believe that sustained robust revenue growth over the next three years provides ample opportunity for valuation appreciation from the existing levels. Utilizing comparative valuation metrics, we project a target price for WGS shares at $87 over the next two months, accompanied by a "Buy" recommendation.
To mitigate risks, we advise establishing a stop-loss at $58. From a technical standpoint, a robust short-term support zone is identified within the range extending from $60 to the 200-day moving average.
Stocks!

NATRIUM | Investing | Why BILL GATES is Betting on NATRIUMBill Gates is betting big on Natrium - should you be, too?
Natrium is this next-generation nuclear reactor design that's attracting a lot of attention from people like Bill Gates and other major investors. What's particularly interesting about it is that it combines a fast reactor with a built-in molten salt "battery." Essentially, it can generate a steady output of power and then provide an extra boost during peak demand by drawing on its stored heat. This design aims for greater flexibility in meeting fluctuating electricity needs.
The technology is a joint development by TerraPower, the company co-founded by Bill Gates, and GE Hitachi. They're presenting it as a zero-carbon power source capable of reliably backing up intermittent renewables like wind and solar, ensuring a consistent supply of clean energy.
The excitement from investors like Bill Gates appears to be driven by the need to address climate change and secure reliable energy supplies. They view Natrium as a way to deliver large-scale, carbon-free power while potentially overcoming some of the limitations of older nuclear reactor designs. Gates has emphasized the enhanced safety features and potential for lower operating costs. Furthermore, Natrium's specific design to complement the intermittency of solar and wind, through its energy storage, is a significant draw for investors looking at future energy solutions. The substantial public and private investment, including government funding and bipartisan legislative support, also signals strong confidence in this technology.
The description of TerraPower as a "Bill Gates-backed" firm developing this multi-billion dollar demonstration plant highlights the high-profile nature of the project. The fact that corporate partners, such as the data center company exploring Natrium for their power needs, are also getting involved indicates a broader recognition of its potential beyond just government initiatives.
Compared to traditional nuclear reactors, Natrium offers some potential advantages. Its sodium coolant operates at near-atmospheric pressure, simplifying safety compared to the high-pressure water systems in older designs. This allows for natural heat dissipation in case of issues, reducing the risk of large steam explosions. Another key aspect is Natrium's potential for more efficient fuel utilization and reduced long-lived waste generation. The design aims for better fuel efficiency and a smaller volume of long-term radioactive waste compared to current light-water reactors.
Natrium's primary advantage over wind and solar is its dispatchability. Unlike the intermittent nature of renewables, Natrium can provide power consistently, 24/7. The integrated energy storage allows it to complement renewables by absorbing excess energy or releasing power during periods of low renewable output. This firm grid support is a significant benefit for utilities concerned about grid stability and the variability of renewable sources.
For utilities transitioning away from coal, Natrium offers a carbon-free, relatively direct replacement in terms of power output. It also has a smaller land footprint compared to large-scale wind or solar installations.
There are inherent challenges with a first-of-a-kind system like Natrium. The prototype is still under construction, lacking a proven operational track record. Construction and licensing processes could face delays and cost overruns. Critics also raise valid points about the actual safety and cost-effectiveness compared to projections. The use of sodium coolant, while offering safety advantages, also presents risks due to its reactivity with air and water, requiring robust containment systems. Regulatory scrutiny will undoubtedly be extensive.
And fuel supply is a critical uncertainty. Natrium requires high-assay, low-enriched uranium (HALEU), which is not currently widely available. Disruptions in the supply chain and limited existing production capacity pose a significant risk to the timely and cost-effective operation of Natrium plants.
Looking ahead, Natrium is being considered for deployment in regions needing reliable power to complement renewables and to power energy-intensive industries. The long-term vision involves integrating Natrium with renewable energy sources to create a more stable and decarbonized grid.
The speculative outlook for Natrium in the next 5-10 years is heavily dependent on the successful completion of the Wyoming demonstration plant. If it meets its targets, it could pave the way for wider adoption. However, the timeline is ambitious, and challenges related to fuel supply and regulatory approvals remain. A successful demonstration could trigger significant investment and adoption in the coming decades, positioning Natrium as a key player in the energy transition.
If you're interested in investing in companies involved with TerraPower's Natrium reactor, several publicly traded firms are integral to its development and supply chain:
🔧 Engineering & Construction
KBR Inc. | (NYSE: KBR)
KBR has formed a strategic alliance with TerraPower to commercialize and deploy Natrium reactors globally. The collaboration focuses on creating a replicable contracting framework to reduce financial risk and ensure cost transparency in deploying Natrium technology.
terrapower.com
⚛️ Nuclear Fuel & Components
BWX Technologies Inc. | (NYSE: BWXT)
BWXT has been awarded a contract by TerraPower to design the Intermediate Heat Exchanger for the Natrium demonstration project. This component is critical for transferring heat within the reactor system.
Centrus Energy Corp. | (NYSE American: LEU)
Centrus Energy is collaborating with TerraPower to establish domestic production capabilities for high-assay, low-enriched uranium (HALEU), which is essential for fueling the Natrium reactor.
⚙️ Manufacturing & Industrial Partners
Doosan Enerbility Co., Ltd. | 034020.KQ (KOSDAQ)
Doosan Enerbility is supplying critical components for the Natrium reactor, including the core barrel and internal supports.
HD Hyundai | 329180.KQ
HD Hyundai is manufacturing the reactor vessel for the Natrium project.
🌍 International Collaborators
SK Inc. | 034730.KQ
SK Inc., a South Korean conglomerate, has invested $250 million in TerraPower to support the demonstration and commercialization of the Natrium reactor.
Korea Hydro & Nuclear Power (KHNP) | 15760.KS (KOSPI)
KHNP has entered into a strategic collaboration with TerraPower to support the Natrium project, leveraging its expertise in nuclear power development.
OTHERS:
1. Mirion Technologies (NYSE: MIR)
Mirion is supplying the Radiation Monitoring System (RMS) and Nuclear Instrumentation System (XIS) for the Natrium Reactor Demonstration Project in Wyoming.
2. GE Vernova (NYSE: GEV)
Through its subsidiary, Global Nuclear Fuel–Americas (GNF-A), GE Vernova is partnering with TerraPower to establish the Natrium Fuel Facility in Wilmington, North Carolina. This facility aims to produce high-assay, low-enriched uranium (HALEU) fuel essential for the Natrium reactor.
3. NuScale Power Corporation (NYSE: SMR)
While not directly involved with the Natrium project, NuScale is a prominent developer of small modular reactors (SMRs), a category that includes Natrium. The company's advancements in SMR technology contribute to the broader nuclear energy landscape.
4. Southern Company (NYSE: SO)
Southern Company is collaborating with TerraPower on the development of a molten chloride fast reactor (MCFR), a separate advanced nuclear project. Their involvement in advanced nuclear technologies aligns with the innovations seen in the Natrium project.
________________________________
Sources: Recent industry reports and news articles and TerraPower press releases provide the data above. Also put together with the help of AI.
world-nuclear-news.org, ans.org, gatesnotes.com, scientificamerican.com, terrapower.com, reuters.com

Celanese Corp | CE | Long at $39.64Celanese Corp is another chemical company (like Dow Inc) crushed by tariffs and economic headwinds. It's dropped -78% in one year.... However, this is a very strong company with strong credit market interest and no immediate liquidity crisis. From a technical analysis perspective, this... like in 2008 and 2020... is the time to gather shares given it has reached the "abysmal crash" levels based on my selected simple moving averages. In the past, recovery to new highs has taken 1-2 years. History doesn't always repeat, but fear is opportunity in the stock market. If negative news continues to reign, a dip into the high $20's isn't out of the question.
If the company can squeak through 2025 and not continue to stack debt (debt/equity=2.43x), the growth opportunity into 2027-2028 looks promising.
I'm keeping my targets into 2026 low, but this could be a good buy and hold for the right investor.
Targets:
$47.00
$54.75

May 6, 2025 - Markets Hold Their Breath Before Powell SpeaksHello everyone, it’s May 6, 2025 and markets are once again at the mercy of politics, Powell, and presidential mood swings.
After a 9-day rally, U.S. markets finally took a breather yesterday, with mild profit-taking ahead of the much-anticipated Federal Reserve decision. Investors are caught between two competing visions: Trump’s push for massive rate cuts, insisting inflation is a myth cooked up by bureaucrats, and Powell’s more sober stance acknowledging inflation isn’t dead, the economy is softening, and premature easing could trigger full-blown stagflation.
With Friday’s job report stronger than expected, Powell is expected to hold rates steady, staying cautious while tariffs and growth clouds loom. Markets are pricing in a July cut at best, but uncertainty lingers mostly around what Trump might tweet in reaction to Powell’s speech tomorrow night.
Meanwhile, despite the 90-day tariff moratorium, the trade war narrative hasn’t vanished. NYSE:F suspended its 2025 outlook, citing $1.5 billion in expected tariff costs and four major risks: disrupted supply chains, retaliatory measures, unclear tax policies, and emission rules. NASDAQ:MAT is also hedging its bets shifting production out of China and pausing forecasts, while begging for zero tariffs on toys “for the kids.” Their stocks dropped modestly after hours.
OANDA:XAUUSD surged again to $3,368, as fear and safe-haven demand ticked up. BLACKBULL:WTI rebounded to over $58 following an OPEC statement, helping airline stocks breathe a bit. BINANCE:BTCUSDT continued its meteoric rise, now sitting around $94,400.
On the macro front, inflation data like CPI and PPI are being shrugged off everyone’s waiting to see if Powell plays ball with Trump. There’s hope, too, that all this chaos is just Trump’s way of muscling the world into negotiation especially China and if a “deal” emerges, markets could rip higher. Until then, we’re stuck dancing between uncertainty and hope.
Asia opened strong this morning, led by China’s cautious optimism. Futures point slightly lower in the U.S., and volatility remains king. The Fed could flip the script tomorrow or keep us hanging. Stay buckled in.

PALANTIR Channel Up intact. Eyeing $185 on this rally.Palantir (PLTR) has been trading within a 2.5-year Channel Up and is currently on its most recent Bullish Leg following the approach f the 1W MA50 (blue trend-line).
Having also rebounded on its long-term RSI Support Zone, the buying pressure is the strongest we've seen inside this pattern, having recovered all loses in just 4 weeks.
Given that the most usual rally was +183.03%, we expect this Leg to reach at least $185.
-------------------------------------------------------------------------------
** Please LIKE 👍, FOLLOW ✅, SHARE 🙌 and COMMENT ✍ if you enjoy this idea! Also share your ideas and charts in the comments section below! This is best way to keep it relevant, support us, keep the content here free and allow the idea to reach as many people as possible. **
-------------------------------------------------------------------------------
💸💸💸💸💸💸
👇 👇 👇 👇 👇 👇

btc . may . w1 . waiting for lower pricesThe squeeze of shorts saw MayOpen pump through the resistance zones finally.
Friday 2pm, gave us the ladder entry to SHORT an SFP just before the weekend.
short . entry . 97368 . tp1 taken . ride the trend
Monday showed no volatility, no trades taken.
Too low to SHORT, too soon to LONG. I'd rather:
SHORT higher - add to position size.
cmVAL . pw0.5 . pwVwap
entry . 95347
tp1 . 90216 . +5.3%
tp2 . 88600 ish . +7%
LONG intraday
cwLow around 2pm and ride this for an intraday LONG into entry SHORT
entry . 93454
tp1 . 95347 . +2%

Microsoft (MSFT) Becomes the World’s Most Valuable CompanyMicrosoft (MSFT) Becomes the World’s Most Valuable Company
According to financial data, Microsoft’s market capitalisation currently stands at approximately $3.24 trillion, while the valuations of Apple and Nvidia — second and third on the list respectively — remain below $3 trillion.
This follows a sharp surge in Microsoft’s share price (MSFT), which has risen by over 26% from its April low.
Why has Microsoft’s share price risen?
The main driver behind the MSFT stock rally was last week’s quarterly report, which outperformed analysts’ expectations:
→ Earnings per share: actual = $3.46, forecast = $3.22;
→ Revenue: actual = $70 billion, forecast = $68.4 billion.
As reported in the media, investors responded positively to a notable increase in revenue from Azure cloud services.
Technical Analysis of Microsoft (MSFT) Shares
A wide bullish gap — over 7% — pushed the price above a key support line that had underpinned the 2024 uptrend in Microsoft stock.
However, following the report’s release, the price stabilised just below a resistance line drawn through previous key highs.
This provides grounds to interpret the current setup as a symmetrical triangle pattern with an axis around the $427 mark, suggesting short-term price consolidation within the defined boundaries.
Going forward, further key news related to Microsoft — a company less exposed to trade war impacts than Apple — could:
→ help maintain its status as the world’s most valuable firm;
→ support a potential bullish breakout through the resistance line and a continuation of the 2024 uptrend.
This article represents the opinion of the Companies operating under the FXOpen brand only. It is not to be construed as an offer, solicitation, or recommendation with respect to products and services provided by the Companies operating under the FXOpen brand, nor is it to be considered financial advice.

Apple Shares (AAPL) Drop Below $200Apple Shares (AAPL) Drop Below $200
Late last week, Apple released a quarterly report that beat analysts’ expectations:
→ Earnings per share: actual = $1.65, forecast = $1.63
→ Revenue: actual = $95.36bn, forecast = $94.5bn
However, today AAPL stock price is below the psychological $200 mark, over 7% lower than last week’s high (point E).
Why did AAPL shares fall?
According to media reports, investors were concerned about weaker-than-expected services revenue and disappointing sales in China. These factors have renewed fears that the ongoing US–China trade tensions could have a deeper impact on Apple going forward.
Bearish sentiment may also have been amplified by Warren Buffett’s decision to step down as head of Berkshire Hathaway — as we noted yesterday — since his company is one of Apple’s major shareholders.
Technical Analysis of Apple Shares (AAPL)
Key AAPL price action patterns (marked) show a sequence of lower highs and lows, forming the basis for a downward channel. Fibonacci ratios reinforce bearish characteristics in price movements:
→ The rise from B to C is approximately 50% of the decline from A to B
→ The rise from D to E is around 50% of the decline from A to D
This technical picture suggests a potential bear market, where rallies may be corrective rebounds following impulsive drops. This strengthens the scenario in which AAPL shares could continue falling within the established descending channel.
This article represents the opinion of the Companies operating under the FXOpen brand only. It is not to be construed as an offer, solicitation, or recommendation with respect to products and services provided by the Companies operating under the FXOpen brand, nor is it to be considered financial advice.

Nightly $SPY / $SPX Scenarios for May 6, 2025 🔮🔮
🌍 Market-Moving News 🌍
📉 Market Retreats Amid Tariff Concerns
U.S. stock markets declined on May 5, 2025, as investors reacted to potential tariffs and key earnings reports. The S&P 500 dropped 0.6%, and the Nasdaq decreased 0.7%. Notably, Palantir Technologies ( NASDAQ:PLTR ) fell nearly 8% in extended trading despite raising its full-year revenue forecast and exceeding Q1 revenue estimates.
🏛️ Fed Meeting Commences Amid Political Pressure
The Federal Reserve's two-day meeting begins today, with the central bank expected to maintain its benchmark interest rate at 4.25%-4.5%. Despite President Trump's calls for rate cuts, the Fed remains cautious due to inflationary risks from new tariffs and migration policies.
🎬 Entertainment Stocks Under Pressure
Streaming giants Netflix ( NASDAQ:NFLX ) and Disney ( NYSE:DIS ) experienced premarket losses of over 5% and 3%, respectively, following President Trump's proposal of a 100% tariff on foreign-made movies.
🏠 Housing Market Faces Challenges
The U.S. housing market is weakening due to persistent high mortgage rates and economic uncertainty driven by tariff policies. Mortgage rates, currently averaging 6.76%, have deterred both prospective buyers and sellers.
📊 Key Data Releases 📊
📅 Tuesday, May 6:
8:30 AM ET: U.S. International Trade in Goods and Services (March)
⚠️ Disclaimer:
This information is for educational and informational purposes only and should not be construed as financial advice. Always consult a licensed financial advisor before making investment decisions.
📌 #trading #stockmarket #economy #news #trendtao #charting #technicalanalysis

DOW JONES: This is why it targets 70,000Dow Jones is marginally bullish on its 1D technical outlook (RSI = 57.838, MACD = 20.320, ADX = 34.615) as the recovery since last month's low is taking a pause ahead of the Fed on Wednesday. Last month's candle closed with an incredible reversal and all this is just noise for long term investors who look at this very chart you have in front of you. The index is basically on the usual -20% correction it undergoes when it is in the middle of a multidecade Bull Cycle. If this is indeed what many call the A.I. Cycle, Dow has a minimum target of 70,000 expected somewhere in 2032.
## If you like our free content follow our profile to get more daily ideas. ##
## Comments and likes are greatly appreciated. ##

MICROSTRATEGY: Big 1W MA50 rebound targeting $845 at worst.MicroStrategy is on excellent bullish technicals on its 1D outlook (RSI = 67.412, MACD = 25.350, ADX = 58.097), capitalizing on the double bottom rebound on the 1W MA50 four weeks ago. Technically that was also a HL bottom on the 2 year Channel Up. The minimum rise it delivered on a bullish wave was +263.38%. Based on that, the trade is long, TP = $845.
## If you like our free content follow our profile to get more daily ideas. ##

MSTR–Institutional Bitcoin Proxy with Conviction and Leverage ₿Company Snapshot:
MicroStrategy NASDAQ:MSTR remains the largest corporate holder of Bitcoin, positioning itself as a leveraged equity proxy for BTC exposure—while still operating a profitable enterprise software business.
Key Catalysts:
Massive Bitcoin Treasury Strategy 💰
Recently acquired $1.42 billion in BTC, reinforcing commitment
Total holdings exceed 200,000 BTC, making it the most visible and transparent institutional crypto holder
Acts as a high-beta vehicle for Bitcoin bulls, especially as ETF flows drive demand
Financial Engineering = Firepower for More BTC 🚀
$722 million in refinanced fixed-income notes, lowering costs and extending maturity
Provides capital flexibility to accumulate BTC at opportunistic levels
Reflects strong capital market access and investor confidence
BTC ETF Tailwind + Institutional Validation ✅
Bitcoin ETFs provide broader adoption and liquidity, indirectly benefiting MSTR
MSTR offers a regulated, equity-based alternative to direct BTC ownership
Ideal for funds restricted from holding digital assets directly
Dual Business Model Stability ⚙️
Core enterprise software business contributes revenue and operational stability
Reduces perceived risk relative to pure-play crypto companies
Investment Outlook:
✅ Bullish Above: $325.00–$326.00
🚀 Upside Target: $490.00–$500.00
🔑 Thesis: High-conviction BTC accumulation + balance sheet optimization = leveraged upside for Bitcoin-focused investors
📢 MSTR: The go-to equity for institutional Bitcoin exposure—with built-in leverage and transparency.
#Bitcoin #MSTR #CryptoStocks #DigitalAssets #MichaelSaylor #InstitutionalCrypto

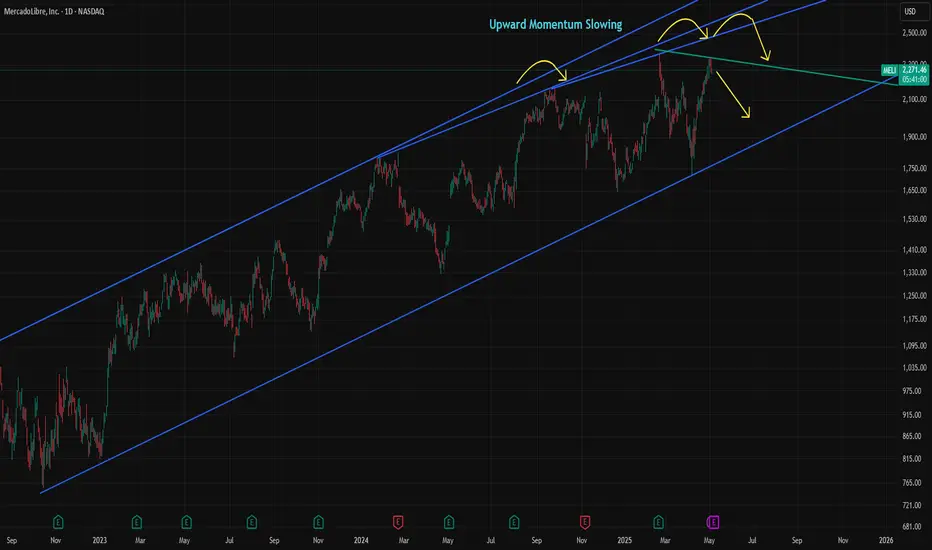
MELI at Risk from Momentum Shift and High ValuationMELI has gained over 35% since the April dip, but momentum has been fading since September. The slowdown has become increasingly visible, and last week's high may remain the top for some time unless Wednesday’s earnings report surprises the market on the upside.
The consensus estimate for MELI’s revenue is $5,497.05 million, representing a 26.86% year-over-year increase but a 9.27% decline quarter-over-quarter. MELI is currently trading at a forward P/E of 41.9x, which is significantly higher than the 19.8x average of comparable companies. Its geographic advantage over U.S.-based peers gave MELI an edge in April, but without strong earnings to support the high valuation, the stock could become vulnerable.
Over the past five years, MELI averaged 56.2% annual sales growth. That figure is expected to fall to an average of 22.1% over the next three years, which remains solid but signals a clear deceleration.
MELI could move more than 7% on earnings day, depending on the report. If the stock falls below 2,000, it may present a buying opportunity. However, the loss of momentum is usually a negative signal for sustaining trends, so the risk of buying the dip is higher than before.
Why I'm not holding Tesla Tesla was dropping! I got in at around 220. However, within three weeks, I sold for a small profit.
BUT, why did I sell? This is why I'm not holding NASDAQ:TSLA
It's time to buy!
From a technical and historical point of view, buying Tesla right now makes perfect sense. The stock has a history of making significant price gains, is currently oversold, and is testing key support areas, such as the monthly 50 SMA.
A trader or investor who is 100% technical-based, this stock looks like a dream.
However, all the hype hits the floor when the fundamentals are considered...
Meh...
✔ The company has been increasing sales and cash year-on-year until recently
✔ Tesla has plenty of cash and assets. A simple acid test ratio shows liabilities vs. assets around 1:2.
❌ The issue is profit. Both gross and net profit margins have been falling year-on-year. The net profit margin is down from 15% two years ago to 7% last year.
❌ Worse, the current forecasts predict decreased sales and other key financials.
Poor and worsening financials are a clear red flag when buying stocks. Stay away. No matter how appealing the price looks.
Don't get me wrong, I don't think Tesla is doomed, and it may still yield returns. However, I would not be surprised if the stock consolidates or moves lower from here. For me, Tesla is not the significant buy it once was.

Buffett Steps Down, Berkshire Shares Pull Back from Record HighBuffett Steps Down, Berkshire Shares (BRK.B) Pull Back from Record High
Berkshire Hathaway has released its quarterly report, which came in slightly below analysts’ expectations:
→ Earnings per share: actual = $4.46, forecast = $4.72
→ Revenue: actual = $90.8bn, forecast = $89.7bn
However, the bigger news was not the weaker results, but the decision of legendary 94-year-old Warren Buffett to step down as head of the company after nearly 60 years in charge. According to Reuters:
→ Vice Chairman Greg Abel will take over leadership;
→ Buffett will still influence decisions and has said he does “not intend to sell a single share of Berkshire”.
In pre-market trading today, BRK.B shares are priced around $526, compared to Friday’s close above $541, which marked a historic high. The decline suggests a natural negative reaction by market participants to the news.
Technical Analysis of BRK.B Stock Price
The Berkshire Hathaway stock price is moving within an upward channel, and:
→ In 2025, it has outperformed the broader equity index, showing a strong recovery following the early April market selloff;
→ Following the recent news, the price will likely retreat from the upper boundary of the channel toward the median line, which may act as support (as it did in late April, as shown by the arrow).
The recent price action appears to be a false bullish breakout above the $535 resistance — a bearish signal.
It’s possible that the initial emotional market reaction may fade, and BRK.B shares could continue to outperform the S&P 500 (tracked via the US SPX 500 mini on FXOpen). Whether this scenario plays out will depend on the leadership and decisions of Greg Abel, especially as the company now holds a record cash reserve of nearly $350 billion.
This article represents the opinion of the Companies operating under the FXOpen brand only. It is not to be construed as an offer, solicitation, or recommendation with respect to products and services provided by the Companies operating under the FXOpen brand, nor is it to be considered financial advice.

NASDAQ's Inverse H&S that targets $25000Nasdaq (NDX) is forming the Right Shoulder of a potential Inverse Head and Shoulders (IH&S) pattern. The price action is 'stuck' within the 1D MA200 (orange trend-line), which got tested on Friday for the first time since March, and the 1D MA50 (blue trend-line).
Since the 1D MA200 was the level that initiated the March 26 rejection, it is possible to see a short-term pull-back now, all in the process of forming the Right Shoulder and after the market digests the new Fed Rate Decision, starts the next Leg Up. Note that the 1D RSI is already on its February highs.
As a result, our long-term Target is at 25000, just below the 2.0 Fibonacci extension level, which is a standard technical target for IH&S patterns.
-------------------------------------------------------------------------------
** Please LIKE 👍, FOLLOW ✅, SHARE 🙌 and COMMENT ✍ if you enjoy this idea! Also share your ideas and charts in the comments section below! This is best way to keep it relevant, support us, keep the content here free and allow the idea to reach as many people as possible. **
-------------------------------------------------------------------------------
Disclosure: I am part of Trade Nation's Influencer program and receive a monthly fee for using their TradingView charts in my analysis.
💸💸💸💸💸💸
👇 👇 👇 👇 👇 👇

Weekly $SPY / $SPX Scenarios for May 5–9, 2025🔮 Weekly AMEX:SPY / SP:SPX Scenarios for May 5–9, 2025 🔮
🌍 Market-Moving News 🌍
🏦 Fed Holds Rates Amid Political Pressure
The Federal Reserve is expected to maintain its benchmark interest rate at 4.25%-4.5% during its meeting on May 6–7, despite political pressure to lower it. Investors will closely monitor Fed Chair Jerome Powell’s post-decision remarks for insights into future monetary policy directions.
📊 Key Economic Indicators on Tap
This week brings several important economic data releases, including the U.S. trade balance, initial jobless claims, consumer credit, and wholesale inventories. These indicators will provide insights into the health of the economy amid ongoing trade tensions and concerns over consumer confidence.
💼 Corporate Earnings in Focus
Major companies such as Palantir ( NASDAQ:PLTR ), Advanced Micro Devices ( NASDAQ:AMD ), Uber ( NYSE:UBER ), Walt Disney ( NYSE:DIS ), and Ford ( NYSE:F ) are scheduled to report earnings this week. Investors will be watching these reports for signs of how companies are navigating the current economic landscape.
🌐 Global Events and Leadership Changes
Europe is set for significant leadership changes, with Friedrich Merz expected to be confirmed as Germany’s new chancellor. Additionally, the Vatican’s conclave to elect a new pope convenes on Wednesday. These events, along with the 80th anniversary of VE Day, may have broader implications for global markets.
📊 Key Data Releases 📊
📅 Monday, May 5:
9:45 AM ET: S&P Global Composite PMI (April Final)
10:00 AM ET: ISM Non-Manufacturing Index (April)
📅 Tuesday, May 6:
8:30 AM ET: U.S. International Trade in Goods and Services (March)
📅 Wednesday, May 7:
2:00 PM ET: Federal Reserve Interest Rate Decision
2:30 PM ET: Fed Chair Jerome Powell Press Conference
📅 Thursday, May 8:
8:30 AM ET: Initial Jobless Claims
10:00 AM ET: Wholesale Inventories (March)
📅 Friday, May 9:
3:00 PM ET: Consumer Credit (March)
⚠️ Disclaimer:
This information is for educational and informational purposes only and should not be construed as financial advice. Always consult a licensed financial advisor before making investment decisions.
📌 #trading #stockmarket #economy #news #trendtao #charting #technicalanalysis

btc . april recap . may outlookMAY instantly starts with a SHORT SQUEEZE
- out of pwRange
- into cwRange + 1 step higher
- all good, all bullish - but a price drop on HTF would open great opportunities for SHORT + LONG, while keeping bullish momentum
02.04.2025 . SHORT IDEA
- after trading out of range, start trading the/within new range
- approaching cmHigh towards 2pm Berlin time
- ladder in for possible SFP
- give yourself a little wiggle room for the SL, if price breaks +2% and approaches the next SFP level, a short entry higher towards friday close has a better R:R
entry. 97368
tp1 . 950908
tp2 . 94095
tp3 . 85113
LONG IDEA
- wait and see where the price find its support
- possibility that we keep STRONG BULL momentum, if price stays within cwVA
- on the way there, find percentage levels for daily +1.5% trades

Nifty Outlook for next weekNSE:NIFTY1!
Expecting a meltdown on Nifty for the next week, then a rapid push up towards the Buyside

MSTR (Strategy) coming up to $395, the smaller resistance levelNASDAQ:MSTR has rebounded from the bottom fairly fast compared to other stocks and indexes. It's even performed better than Bitcoin itself. However it should be hitting heavy resistance now near 395-400 and above is only heavier resistance. It's time for a pullback and a breather for MSTR. Target is the Point of Control near $350, before going higher. However we could turn bullish again before reaching $350
I personally know someone who played with fire by buying MSTR options calls while it was dropping before, meaning he was trying to catch a falling knife and got burnt finally. He lost nearly $500,000 because of it. So I don't mess with options personally, however I will margin trade with stocks and trade futures, forex and leverage trade cryptocurrencies.

Nu Holdings (NU, 1D) — Technical AnalysisNu Holdings (NU, 1D) — Technical Analysis: Trendline Breakout, EMA/MA Confirmation, Recovery Toward Key Levels
On the daily chart, Nu Holdings has broken out of a descending trendline, signaling a potential structural reversal. The breakout was confirmed by a close above key exponential and simple moving averages (EMA 50/100/200), with the EMAs beginning to align in a bullish sequence. The price has held above the critical Fibonacci retracement level at $11.73 (0.618), which now serves as a key demand zone. Volume shows signs of increasing during upward impulses, suggesting accumulation interest. The current recovery structure indicates potential targets at $12.58 (0.5 Fibonacci), followed by $13.42 (0.382) and $14.46 (0.236). A more extended move could lead toward the previous supply zone near $16.15 if momentum persists.
From a fundamental standpoint, Nu Holdings continues to attract investor attention within the fintech sector, especially amid broader rotation back into growth and tech-driven financial platforms. The company's expanding market presence and improving financial metrics may support the current technical setup. As long as the price holds above the broken trendline and maintains strength above the key $11.73 level, the bullish scenario remains in focus with targets pointing toward the $13.42–$14.46 range and potentially higher in the medium term.

US100 - Perfect Long Opportunities Unfolding?This chart illustrates a high-probability bullish setup based on a combination of market structure shifts, fair value gaps (FVGs), Fibonacci retracement confluence, and order block interaction. We are analyzing the US Tech 100 on the 1-hour timeframe, focusing on recent price action development and a potential reversal scenario forming after a corrective move.
Context and Market Structure:
Price action has been in a corrective downtrend after printing a local high near the 19,950–20,000 range. This move led to a break in short-term bullish structure as sell-side liquidity was swept. A series of bearish candles followed, confirming a shift in momentum to the downside.
However, the retracement stalled upon entering a prior area of imbalance—highlighted here as a larger fair value gap (FVG) zone. This FVG zone acted as a significant demand area, with price reacting strongly upon entry. The zone is marked with a light blue shaded rectangle and aligns with a 1-hour bullish order block.
Price created a swing low in this FVG area before forming higher lows, suggesting the possibility of a short-term reversal.
Golden Pocket & Liquidity Sweep:
A key zone of interest is the "Golden Pocket downtrend" area, which is derived from the 0.618–0.65 Fibonacci retracement levels of the last impulse down. Price previously respected this zone, leading to a rejection and continuation lower. This makes it a notable supply area. Price may revisit this zone as a target or potential reaction point on the next bullish leg.
Note how the initial reaction from the FVG brought the market back into a smaller 1H FVG, situated just beneath the 0.5 retracement level. The internal structure within this zone supports a bullish outlook due to the formation of a higher low followed by a bullish engulfing candle.
Fibonacci Confluence & Execution Levels:
The 0.618 Fibonacci retracement level of the recent move aligns closely with the midpoint of the bullish FVG, providing confluence for a potential re-entry or continuation point. This level is annotated on the chart and highlighted with a horizontal line labeled "0.618 - Entry." This suggests it may act as a magnet for price before further continuation to the upside.
The 0.786 retracement level, also plotted on the chart, indicates the deeper end of the retracement spectrum and lies just above a major structural low. This region, though aggressive, would represent a final line of defense for bullish continuation.
Projection and Price Path:
Based on the current structure and bullish reaction from the FVG zone, a potential price path is drawn on the chart. It suggests one more liquidity grab into the FVG area followed by an impulsive move to the upside.
The blue projection line outlines a potential retracement to fill the nearby FVG (which remains partially unmitigated), followed by a resumption of bullish momentum that targets a revisit to the previous high area around 19,875.
Additional Notes:
* Multiple FVGs are actively interacting in this region, giving layered confluence for demand zones.
* The reaction from the FVG zone is coupled with a bullish engulfing pattern on the 1-hour timeframe, signaling aggressive buying.
* Price remains above the internal bullish structure despite the earlier rejection from the Golden Pocket area.
Conclusion:
The chart setup represents a textbook example of FVG demand zone reaction, supported by Fibonacci confluence and market structure shifts. As price consolidates above this key FVG, a continuation to the upside becomes a strong probability if the internal structure remains intact. Traders should monitor price behavior on lower timeframes as it interacts with the 0.618 and FVG zones for confirmation of bullish continuation.

Asahi songwon Color tring to score a break out. Asahi Songwon Colors Ltd. engages in the business of manufacturing and export of color pigments and its derivatives.
Asahi Songwon Colors Ltd. Closing price is 361.40. The positive aspects of the company are Companies with Zero Promoter Pledge, Stocks Outperforming their Industry Price Change in the Quarter, Annual Profit Growth higher than Sector Profit Growth and Companies with Upcoming Results. The Negative aspects of the company are high Valuation (P.E. = 29.8), Increasing Trend in Non-Core Income and Declining Net Cash Flow : Companies not able to generate net cash.
Entry can be taken after closing above 364 Historical Resistance in the stock will be 382 and 399. PEAK Historic Resistance in the stock will be 420 and 440. Stop loss in the stock should be maintained at Closing below 333 or 313 depending upon your risk taking ability.
Disclaimer: The above information is provided for educational purpose, analysis and paper trading only. Please don't treat this as a buy or sell recommendation for the stock or index. The Techno-Funda analysis is based on data that is more than 3 months old. Supports and Resistances are determined by historic past peaks and Valley in the chart. Many other indicators and patterns like EMA, RSI, MACD, Volumes, Fibonacci, parallel channel etc. use historic data which is 3 months or older cyclical points. There is no guarantee they will work in future as markets are highly volatile and swings in prices are also due to macro and micro factors based on actions taken by the company as well as region and global events. Equity investment is subject to risks. I or my clients or family members might have positions in the stocks that we mention in our educational posts. We will not be responsible for any Profit or loss that may occur due to any financial decision taken based on any data provided in this message. Do consult your investment advisor before taking any financial decisions. Stop losses should be an important part of any investment in equity.
