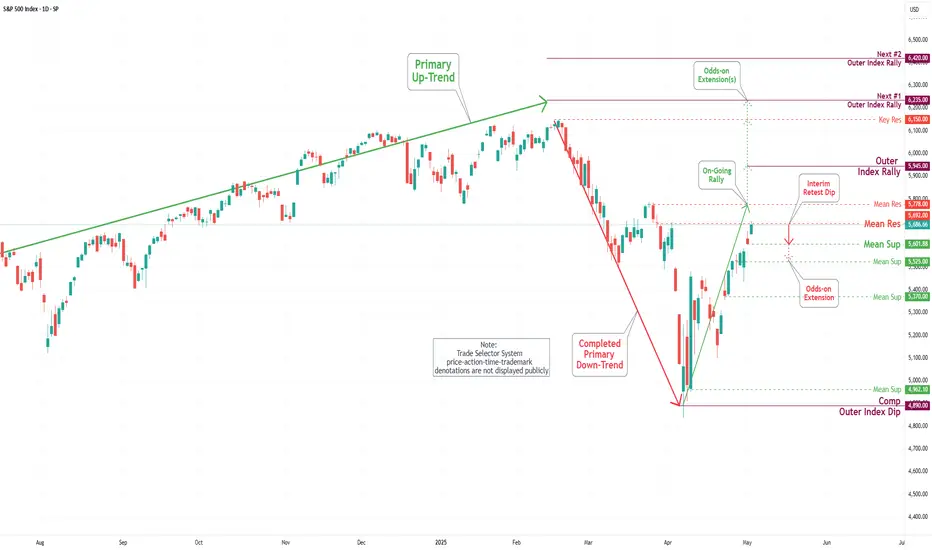
S&P 500 Daily Chart Analysis For Week of May 2, 2025Technical Analysis and Outlook:
During this week's trading session, the Index demonstrated a steady to higher price movement, achieving a key target at the Outer Index Rally level of 5550 and successfully surpassing the Mean Resistance level of 5672. This trajectory establishes the foundation for sustained upward momentum as it approaches the Mean Resistance level of 5778 and sets sights on reaching the next Outer Index Rally target marked at 5945. However, it is essential to acknowledge the substantial risk of a sharp retracement from the current price level to the Mean Support level of 5601, with the potential for further decline to the Mean Support level of 5525.
Stocks!
Netflix Skyrockets After Q1 Revenue Surge: What’s Next?📺 NASDAQ:NFLX has recently exhibited a strong bullish trend, supported by both technical breakout structure and positive fundamental developments. After an extended rally from the March lows, the stock managed to break above a key resistance zone between $1,080 and $1,100, it has now been decisively cleared. With this breakout, the structure confirms bullish momentum, and the expectation is for a retest of this newly formed support area before resuming the uptrend.
The price is currently around $1,133, and a pullback into the $1,060–$1,080 zone would present a high-probability buy opportunity. This aligns with classic price action behavior: after a breakout, markets often retrace to test former resistance, now turned support. If we see it retest, it would validate the technical setup for a continuation move toward the projected target of $1,220.
🌟From a fundamental perspective, the recent Q1 earnings report (released on April 17, 2025) added strong fuel to the upside momentum. Netflix reported $10.54 billion in revenue for the quarter, exceeding Wall Street’s expectations and representing a 13% year-over-year growth. Net income also impressed, coming in at $2.9 billion. Perhaps more telling than the earnings themselves was Netflix’s decision to stop reporting quarterly subscriber numbers. This shift in focus toward profitability and revenue per user signals confidence in their monetization model and emphasizes a transition to a more mature phase of growth. Management’s tone on the earnings call adds to all this, citing growing traction in its ad-supported tier and plans to expand into live sports and podcast-style content.
💰Technically, the overall structure remains bullish. The breakout is clean, and volume is supportive. The area above $1,140 has low volume resistance, which means price can move relatively easily toward the next psychological barrier at $1,220. Any deeper pullback that breaches below $1,020 would invalidate the short-term bullish bias, as it would signal a failure to hold above former resistance and could mean the start of a deeper correction toward the trendline support from last October.
🚀 In conclusion, the current market behavior suggests Netflix is in the process of forming a bullish continuation, supported by a clean breakout above prior resistance, robust financial performance, and an optimistic revenue outlook.
Price is likely to retest the breakout zone, offering a potential long setup anticipating a move higher if momentum remains strong. The technical picture is backed by future growth plans, making Netflix a stock to watch closely in the coming weeks for confirmation of the pullback and continuation.

NVIDIA 1D — When “Head & Shoulders” Aren’t Just for the GymOn the daily chart, NVDA has broken out of the descending channel and reclaimed the 50-day moving average (MA50), triggering a classic inverted head and shoulders formation. Price is now holding above the key $113–$114.50 zone, confirming a structural shift. As volume picks up, buyers are eyeing the next levels of resistance.
Near-term upside targets: – $119.80 (0.5 Fibonacci) – $127.62 (0.382) – $137.28 (0.236) — primary resistance zone – Extended target — $152.91 (1.0 Fibonacci projection)
Technical setup: — Breakout from channel + above MA50
— Inverted head and shoulders pattern completed
— $114.50–$118.00 now acts as buyer support
— EMA and MA convergence supports trend reversal
— Increasing volume on rallies supports bullish momentum
Fundamentals: NVIDIA remains the AI and semiconductor sector leader. Growing demand for high-performance GPUs in AI and data centers positions NVDA as a core tech play. Expectations of strong earnings and continued institutional accumulation support the bullish narrative.
The confirmed breakout and inverted H&S setup mark a clear structural reversal. As long as price stays above $114.50, the path toward $127–$137 remains the primary target zone, with $152.91 in sight if momentum continues.

This AI-Backed IPO Is Just Warming Up — Next Stop: 86% Gains?CoreWeave is showing classic IPO 'honeymoon phase' price action, with early liquidity swept and bullish structure forming.
🔍 Price swept the daily sell-side liquidity at $35.70
📈 Now pushing higher — next major buyside targets at $55.04 and $65.22
🤖 Backed by NVIDIA, adding serious momentum and credibility
🧠 Expecting strong continuation as institutions begin to build exposure
If price maintains structure, this could be one of the strongest IPO moves of 2025.

Tesla - The Next 7 Days Decide Everything!Tesla ( NASDAQ:TSLA ) is sitting at a crucial structure:
Click chart above to see the detailed analysis👆🏻
Despite the -60% correction which we have been seeing over the past couple of months, Tesla still continuously validates its overall uptrend. That's exactly the reason for my strong bullish thesis and the assumption, that after we see bullish confirmation, Tesla will reject the current support area.
Levels to watch: $250, $400
Keep your long term vision,
Philip (BasicTrading)

BROADCOM: Long term Channel Up points to $350 within 2025.AVGO is bullish on its 1D technical outlook (RSI = 64.250, MACD = 3.500, ADX = 29.483) as last week it crossed and close over its 1W MA50 and on the current 1W candle it is about to close over the 0.618 Fibonacci retracement level as well. This is similar to the November-December 2022 fractal that followed after the last major market bottom. Both sequences bottomed on the same 1W RSI level (34.80), so the structures share more similarities than differences. Since the 3 year pattern is a Channel Up, the stock is now on the new bullish wave aiming for the next HH. The 2022 rebound reached the 1.618 Fib extension before consolidating for weeks, so our long term target is the current 1.618 Fib (TP = $350.00).
## If you like our free content follow our profile to get more daily ideas. ##
## Comments and likes are greatly appreciated. ##

NVIDIA Massive bullish break-out after 4 months of selling.NVIDIA Corporation (NVDA) made a critical bullish break-out yesterday (in the aftermath of Meta's and Microsoft AI capex numbers) as it didn't just break above the 1D MA50 (blue trend-line) that has been intact as a Resistance since February 27 but also above the top of the Channel Down that has been the dominant pattern throughout this correction since the January 07 All Time High (ATH).
The 1D RSI is on an Inverse Head and Shoulders (IH&S) pattern, which is always bullish and if NVDA closes a 1D candle above the 1D MA50 next, then our short-term Target will be 143.50, which is just below Resistance 1 and the 2.0 Fibonacci extension.
-------------------------------------------------------------------------------
** Please LIKE 👍, FOLLOW ✅, SHARE 🙌 and COMMENT ✍ if you enjoy this idea! Also share your ideas and charts in the comments section below! This is best way to keep it relevant, support us, keep the content here free and allow the idea to reach as many people as possible. **
-------------------------------------------------------------------------------
💸💸💸💸💸💸
👇 👇 👇 👇 👇 👇

TSLATesla is in a correction phase, the price has a chance to test the support zone 246-218. If the price can stay above 218, it is expected that the price will have a chance to rebound. Consider buying the red zone.
🔥Trading futures, forex, CFDs and stocks carries a risk of loss.
Please consider carefully whether such trading is suitable for you.
>>GooD Luck 😊
❤️ Like and subscribe to never miss a new idea!

Microsoft (MSFT) Share Price Jumps Nearly 9% – What’s Next?Microsoft (MSFT) Share Price Jumps Nearly 9% – What’s Next?
As the chart shows, Microsoft (MSFT) shares surged sharply, forming a large bullish gap: while trading closed around $391 on 30 April, yesterday’s candlestick closed just below the $425 mark.
What Drove the Rally in Microsoft Shares?
Microsoft released its financial results for the first quarter of 2025, exceeding Wall Street expectations on both revenue (actual = $70.1 billion, 2.4% above forecasts) and earnings per share (actual = $3.46, 7.4% above forecasts).
Particular attention was drawn to the strong performance of Azure – revenue from Azure and other cloud services soared by 33% year-on-year. A significant part of this growth was fuelled by robust demand for artificial intelligence services, which helps ease concerns about the return on large-scale infrastructure investments related to AI.
In addition, Microsoft issued an upbeat outlook for the next quarter, which ultimately triggered the sharp rise in its share price.
Technical Analysis of MSFT Chart
Yesterday’s candlestick closed near its low (highlighted by the arrow), indicating that bears were active during the trading session. From a technical analysis perspective, this can be explained by the proximity of the price to two key resistance lines:
1 → The upper boundary of a descending channel drawn from significant price action patterns (marked in red). The relevance of this channel is confirmed by the price’s behaviour near its median line (dashed).
2 → A former trendline that served as support throughout 2024.
Therefore, a short-term correction cannot be ruled out following the sharp rally in MSFT shares, potentially tempering some of the enthusiasm generated by Microsoft’s strong quarterly report.
This article represents the opinion of the Companies operating under the FXOpen brand only. It is not to be construed as an offer, solicitation, or recommendation with respect to products and services provided by the Companies operating under the FXOpen brand, nor is it to be considered financial advice.

Nightly $SPY / $SPX Scenarios for May 2, 2025🔮 Nightly AMEX:SPY / SP:SPX Scenarios for May 2, 2025 🔮
🌍 Market-Moving News 🌍
🇺🇸 Rising Unemployment Claims Signal Labor Market Softening
Initial jobless claims increased by 18,000 to 241,000 for the week ending April 26, marking the highest level since late February. Continuing claims also rose to 1.916 million, indicating potential cracks in the labor market.
🏭 Manufacturing Sector Contracts Amid Tariff Pressures
The ISM Manufacturing PMI fell to 48.7 in April from 49.0 in March, indicating a second consecutive month of contraction. Tariffs on imported goods have strained supply chains and elevated input prices, contributing to the downturn.
📉 Construction Spending Declines
Construction spending decreased by 0.5% in March, reflecting reduced investments in both residential and nonresidential projects. This decline suggests caution in the construction sector amid economic uncertainties.
📊 Mixed Signals from Manufacturing Indices
While the ISM Manufacturing PMI indicates contraction, the S&P Global Manufacturing PMI remained steady at 50.2 in April, suggesting stability in some manufacturing segments despite broader challenges.
📊 Key Data Releases 📊
📅 Friday, May 2:
💼 Nonfarm Payrolls (8:30 AM ET)
Provides insight into employment trends and overall economic health.
📈 Unemployment Rate (8:30 AM ET)
Measures the percentage of the labor force that is unemployed and actively seeking employment.
💰 Average Hourly Earnings (8:30 AM ET)
Indicates wage growth and potential inflationary pressures.
🏭 Factory Orders (10:00 AM ET)
Reflects the dollar level of new orders for both durable and nondurable goods, indicating manufacturing sector strength.
⚠️ Disclaimer:
This information is for educational and informational purposes only and should not be construed as financial advice. Always consult a licensed financial advisor before making investment decisions.
📌 #trading #stockmarket #economy #news #trendtao #charting #technicalanalysis

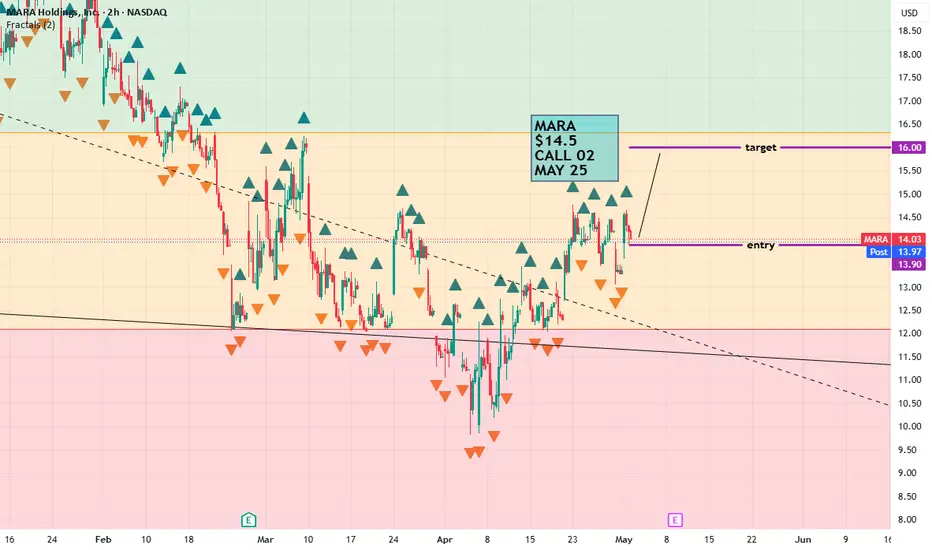
$MARA $14.5 call *This is not financial advice, so trade at your own risks*
*My team digs deep and finds stocks that are expected to perform well based off multiple confluences*
*Experienced traders understand the uphill battle in timing the market, so instead my team focuses mainly on risk management
!! This chart analysis is for reference purposes only !!
If you want to see more, please like and follow us SimplyShowMeTheMoney
$16.50 to $39 in less than 24 hours Uptrend was too good to pass on at $16 so I said this could continue uptrending to $30, $40.
The next morning it goes on a power vertical into $40 area NASDAQ:CEP
Congrats if you saw my messages and jumped in!

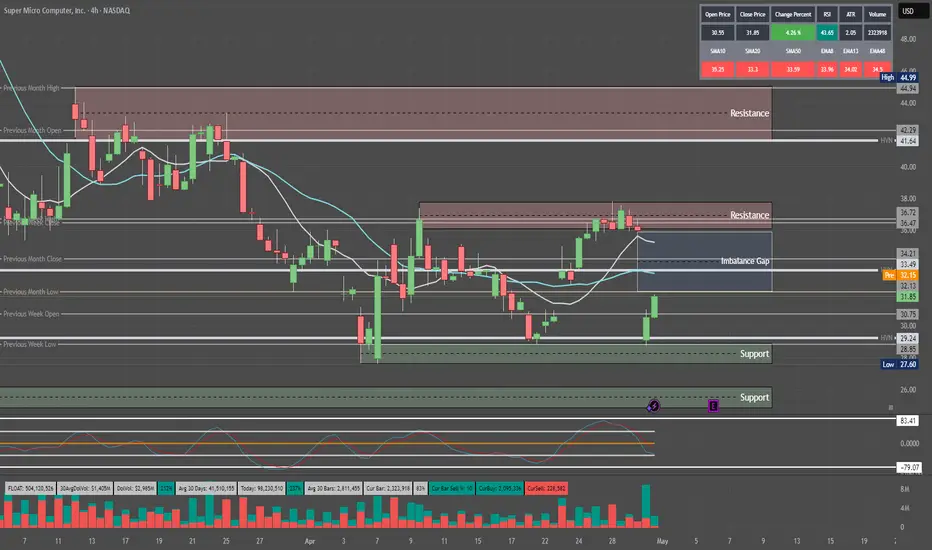
Quantum's SMCI Trading Levels 5/1/25Really don't understand this stock but retail really loves it. Seems like they want to push this to 36 for a possible run up into earnings before possibly dumping.

btc. SHORT to LONGwe saw a nice price rotation downwards, following the idea of NY giving up the SFP on tuesday and started looking for lower prices themselves.
SHORT entry running ASIA high at 2pm
entry . 95146
tp1 . 93453 . +1.78%
the 1h SUPPORT LEVEL of ASIA . 92902
held SUPPORT during that down price rotation.
LONG IDEA
see a rotation to dOpen / cw0.5 / value area Low / micro SFP / 2pm
entry . 94000
tp1 . 96.972
at 1 step extension of cw

LYFT, 3D Daily Breakout Confirms Potential Mid-Term ReversalOn the 3-day chart of Lyft, price action is developing within a potential mid-term reversal structure. The key trigger was the breakout of the descending trendline on the daily timeframe, signaling a shift in momentum after an extended downtrend.
The asset bounced from the long-term ascending support zone around $9.66, and the structure now points to a possible expansion toward key Fibonacci retracement levels:
Upside targets based on Fibo levels:
– $14.36 (0.5)
– $15.47 (0.618)
– $17.05 (0.786)
– Extended: $24.88 (1.618)
Technical Highlights:
– Breakout confirmed on daily chart trendline
– 3D chart shows tightening triangle pattern
– Stochastic momentum turning bullish from oversold levels
– Volume profile supports accumulation, not distribution
– Resistance zone: $14.30–$17.00
– Holding above the breakout trendline keeps the bullish setup valid
Fundamental Context:
Lyft is restructuring operations, with narrowed losses, improved efficiency, and customer retention focus. The company is regaining share in the ride-hailing segment, and investors are beginning to price in operational stabilization. The improving sentiment is reflected in growing institutional interest and mid-term positioning.
This is a potential mid-term bullish scenario, activated by the daily breakout and confirmed if price holds above the trendline. A push above $15.50–$17.00 could unlock the full target at $24.88. As long as structure holds, this remains a strong trend reversal setup.

US500 - Long-Term Long!Hello TradingView Family / Fellow Traders. This is Richard, also known as theSignalyst.
📈US500 has been overall bullish trading within the rising channel marked in blue.
Moreover, it is retesting its previous all-time high at $4,800 and round number $5,000.
🏹 Thus, the highlighted blue circle is a strong area to look for buy setups as it is the intersection of previous ATH and lower blue trendline acting as a non-horizontal support.
📚 As per my trading style:
As #US500 approaches the blue circle zone, I will be looking for bullish reversal setups (like a double bottom pattern, trendline break , and so on...)
📚 Always follow your trading plan regarding entry, risk management, and trade management.
Good luck!
All Strategies Are Good; If Managed Properly!
~Rich
Disclosure: I am part of Trade Nation's Influencer program and receive a monthly fee for using their TradingView charts in my analysis.

What Is Dollar-Cost Averaging (DCA) in Investing and Trading?What Is Dollar-Cost Averaging (DCA) in Investing and Trading?
Dollar-cost averaging (DCA) is a popular strategy used by investors and traders to manage market fluctuations and build positions over time. Instead of trying to time the market, DCA focuses on consistent, regular investments regardless of price movements. This article answers “What is DCA?”, its advantages and limitations, and how it can be applied in both investing and trading.
What Is Dollar-Cost Averaging (DCA)?
So what is DCA investing? Dollar-cost averaging (DCA) is a strategy that involves consistently investing a fixed sum at regular intervals, regardless of the asset’s current price. This approach helps distribute the cost of purchases over time, potentially reducing the impact of short-term price fluctuations. Instead of trying to time the market perfectly—a challenging task even for experienced traders—a dollar-cost averaging strategy focuses on regular contributions to average the cost of assets.
This method offers a straightforward, disciplined strategy for both long-term investors and traders who wish to build or adjust positions gradually. By spreading out purchases, a DCA strategy may help mitigate the effects of market volatility. For example, during a period of market decline, the fixed investment buys more units at a lower cost, which could result in higher returns when prices recover. Conversely, during a sustained rise, the investor buys fewer units, which helps avoid overexposure. For example, if you invest $50 every week and the market is rising, you will buy fewer stocks, but when the market is moving down, you will buy more with the same amount.
What does DCA mean for market participants? DCA is particularly useful in uncertain economic environments where price swings are common. It provides a systematic approach to entering the market, removing the need to make snap decisions based on short-term market movements, and fostering a steady accumulation of assets over time.
How Does DCA Work?
DCA investing operates by establishing a regular schedule for investing a set amount of money into a chosen asset, regardless of its current market price. Instead of waiting for a particular price or market condition, funds are allocated at consistent intervals—be it weekly, monthly, or quarterly. Over time, this means buying more units when prices are lower and fewer units when prices are higher, resulting in an average purchase price that can be lower than if the investment was made in one lump sum.
Consider an investor using DCA. They commit £100 every month to buy company shares. In the first month, the share price is £20, so they purchase 5 shares. The next month, the price drops to £10, allowing them to buy 10 shares with the same £100. In the third month, the price rises to £25, and they purchase 4 shares.
Over three months, the investor has spent £300 and acquired 19 shares in total. To calculate the average cost per share, divide £300 by 19, which equals approximately £15.79 per share. This average is lower than the highest price paid and reflects the effect of buying more shares when prices are low and fewer when prices are high.
DCA also simplifies the process of entering the market. By adhering to a set timetable, investors bypass the need for constant market analysis, making it particularly appealing for those who prefer a more hands-off strategy. This systematic approach can be applied not only to traditional investments like shares and funds but also to other assets that traders and investors engage with.
DCA in Trading
DCA isn't just for long-term investors; traders can also employ it to navigate the ups and downs of fast-moving markets. By spreading out their entries or exits, traders may potentially lower the average cost of a position or build on a winning trend, all while managing their exposure to volatile moves.
Lowering the Average Price
For traders facing a position that's moving against them, DCA offers a way to adjust the average entry cost. By allocating additional funds, the average price of the position may be reduced. This approach can create a potential opportunity to exit with better returns if the market reverses. However, it is important to note that this method also increases exposure, and additional entities might compound losses if the trend continues.
Adding to a Winner
Conversely, traders may apply DCA to increase their positions when an asset shows strength. By gradually adding to an effective trade, the overall exposure is built in a controlled manner, potentially capturing further movement without committing all capital at once. This method is particularly popular in markets where momentum builds slowly, allowing traders to gradually take advantage of the sustained trend.
Applications Across Markets
Using DCA in stocks can help manage entries during periods of volatility, especially when market sentiment shifts rapidly. Forex traders often use similar techniques to adjust positions in response to fluctuating currency pairs, while the high volatility seen in crypto* markets makes DCA an appealing strategy for building positions gradually.
When using DCA in trading, a disciplined approach is essential. Whether lowering the average cost in a losing position or building on an effective trade, traders should carefully consider the additional risk that comes with increased exposure.
Advantages of Dollar-Cost Averaging
Dollar-cost averaging offers a range of advantages that make it an attractive strategy for both investors and traders, especially when navigating uncertain markets.
Mitigating Market Volatility
By investing a fixed amount at regular intervals, DCA spreads out exposure over time. This approach can reduce the impact of sudden market swings. Instead of being affected by a one-off high price, the average cost is spread across different market conditions. This may help stabilise entry points and smooth out short-term volatility.
Disciplined Investment Approach
DCA promotes a structured investment routine. With regular contributions, there is less temptation to try timing the market. This disciplined approach might be particularly useful when markets are highly volatile or ahead of news and economic events. It encourages systematic investing, reducing the likelihood of making impulsive decisions driven by market noise.
Accessibility for All Traders
DCA does not require intricate market analysis or deep expertise in market timing. Its straightforward nature makes it appealing to both newcomers and seasoned traders looking for a simpler method to build positions over time. By providing a clear framework, DCA allows traders to focus on long-term goals without the pressure of constant market monitoring.
Limitations of Dollar-Cost Averaging
While dollar-cost averaging offers a structured approach to investing and trading, there are some limitations to consider.
Potential Opportunity Cost
Spreading out investments means funds are gradually deployed over time. In a market that is consistent, waiting to invest might lead to missed returns compared to committing all funds upfront. This method can reduce the impact of volatility but might underperform during extended trends.
Continued Exposure to Market Trends
Investors remain exposed to the market throughout the investment period. If the market experiences a prolonged trend, regular investments will accumulate at better prices, but overall returns may still suffer. This approach does not eliminate market risk and requires a long-term perspective to potentially see a turnaround.
Dependence on Consistency
The effectiveness of dollar-cost averaging relies heavily on maintaining a consistent investment schedule. Any interruption or inconsistency can dilute the intended advantages of the strategy. It also assumes that investors are able to commit regular funds, which may not be feasible in all financial situations.
Comparing DCA to Lump-Sum Investing
Comparing DCA to lump-sum investing offers insights into different approaches to managing market exposure and returns.
Risk Exposure
Lump-sum investing involves placing all available funds into an asset at once. This method can yield higher returns if the market moves in their favour, but it also exposes the investor to immediate risk if the market moves against them. In contrast, risk is spread over time through a dollar-cost average, meaning regular investments reduce the likelihood of entering the market at a high point and potentially lowering the overall average cost.
Market Conditions
The performance of each approach can vary depending on market trends. In steady trends, lump-sum investing may capture more returns since all funds are deployed early. However, in volatile or declining conditions, DCA could mitigate the effects of short-term fluctuations by smoothing out entry prices over time.
Flexibility and Commitment
Lump-sum investing requires confidence and a readiness to commit all funds immediately. DCA, on the other hand, offers a more measured entry into the market. This method is popular among those who prefer a systematic approach and might not have a large sum available at one time.
The Bottom Line
Understanding the dollar-cost averaging definition can help investors and traders potentially manage market volatility and reduce emotional decision-making. While it has its limitations, DCA can be an effective strategy for building positions over time.
FAQ
What Is an Example of Dollar-Cost Averaging?
Imagine investing £100 into a stock every month, regardless of its price. In January, the stock costs £20, so you buy five shares. In February, the price drops to £10, allowing you to buy 10 shares. In March, the price rises to £25, and you buy four shares. Over three months, you’ve invested £300 and purchased 19 shares, averaging out your cost per share to £15.79.
Is There the Best Dollar-Cost Averaging Strategy?
The most effective DCA strategy depends on individual goals. A consistent, long-term approach with regular investments—whether weekly or monthly—may help smooth out market volatility. Focusing on diversified assets could also reduce risk exposure.
What Is the Daily DCA Strategy?
This strategy involves investing a fixed amount every day through DCA, meaning it may help minimise the impact of short-term price fluctuations in volatile markets. However, it requires careful planning due to frequent transactions and potential fees.
Does Dollar-Cost Averaging Work With Stocks?
Yes, DCA is commonly used with stocks. It may help manage the effects of market volatility, allowing investors to build positions over time without worrying about short-term price swings.
What Does DCA Mean in Stocks?
DCA, or dollar-cost averaging, in stocks, means regularly investing a fixed amount, regardless of price, to average out the cost per share over time and manage market volatility. A similar answer is true for “What does DCA mean in crypto*?”, except it would involve a regular fixed investment in a particular cryptocurrency*.
How to Calculate DCA in Crypto* Investing?
There is a simple formula to calculate DCA, meaning in crypto*, an investor would just divide the total amount invested by the total number of units purchased. This provides the average cost per unit over time, regardless of price fluctuations.
*Important: At FXOpen UK, Cryptocurrency trading via CFDs is only available to our Professional clients. They are not available for trading by Retail clients. To find out more information about how this may affect you, please get in touch with our team.
This article represents the opinion of the Companies operating under the FXOpen brand only. It is not to be construed as an offer, solicitation, or recommendation with respect to products and services provided by the Companies operating under the FXOpen brand, nor is it to be considered financial advice.

Macro Bullish Rates?An over simplification? I hope so.
The narrative fits too close for me. Needless to say, it's worth keeping an eye on.
If we manage to keep interest rates low for a while but inflation creeps in again (not due to high demand but because of monetary inflation) I can see the debt spiral scenario playing out in full force. This is a chilling thought, not something my generation has been exposed to and I believe it could have a very different impact to the population than the previous cycle. The difference being of course, the inflation not being demand driven but monetary debasement driven. To me this practically means a more impoverished population that is already struggling and those holding assets will further increase their portion of the pie.
There are a lot of unknows for me, as I basically know nothing about this. These are just my back of napkin thoughts. Me, trying to make sense of the world we live in because I know you can't look to anyone for the answer. Why? Frankly, I have learned that 98% of us don't know anything.
Ps - I am still not taking the deflationary narrative play off the table. Population decline, low interest rates and using robots to increase GDP etc. But either way all I can see is a exponential increase in debt creation. What other option is there? Both scenarios can't possibly lead to the same outcome, can they?

Nightly $SPY / $SPX Scenarios for May 1, 2025 🔮 Nightly AMEX:SPY / SP:SPX Scenarios for May 1, 2025 🔮
🌍 Market-Moving News 🌍
🇺🇸 Q1 GDP Contraction Raises Recession Fears
The U.S. economy shrank for the first time in three years, down 0.3% in Q1. Weaker government spending and a rise in imports ahead of Trump’s tariff policies are weighing on growth outlook.
📈 Big Tech Lifts the Market
Strong earnings from Microsoft ( NASDAQ:MSFT ) and Meta ( NASDAQ:META ) have boosted sentiment. Meta’s revenue guidance and capex surge point to aggressive growth positioning in AI and infrastructure.
🏛️ Treasury Refunding Outlook in Focus
Markets are watching the quarterly refunding announcement for clues on upcoming bond issuance. This could influence rate volatility as the Treasury balances deficits and market demand.
🌐 Risk-On Mood Despite Macro Headwinds
Global stocks notched a 4-week high as traders bet on resilient earnings and central bank policy steadiness, even as U.S. macro data softens.
📊 Key Data Releases 📊
📅 Thursday, May 1:
📈 Initial Jobless Claims (8:30 AM ET)
Tracks new unemployment filings – a key gauge of near-term labor market stress.
📈 Continuing Jobless Claims (8:30 AM ET)
Measures ongoing unemployment benefit recipients, reflecting persistent joblessness.
🏗️ Construction Spending (10:00 AM ET)
Reports monthly change in total construction outlays — a direct measure of real economy investment.
🏭 ISM Manufacturing PMI (10:00 AM ET)
Provides a snapshot of U.S. factory activity. Readings below 50 suggest contraction.
⚠️ Disclaimer:
This information is for educational and informational purposes only and should not be construed as financial advice. Always consult a licensed financial advisor before making investment decisions.
📌 #trading #stockmarket #economy #news #trendtao #charting #technicalanalysis

NVIDIA: Don't turn your back on the A.I. darling yet.NVIDIA has turned neutral on its 1D technical outlook (RSI = 48.902, MACD = -2.040, ADX = 28.815) as it has recovered a portion of the 2 month correction. April's low was exactly on the 1W MA100 just like the Low of the 2024 consolidation phase has been near the 1W MA50. The pattern is recurring and the rallies naturally get weaker each time as we approach the end of the Cycle this year. The 1st rally was +358%, the 2nd +257% so the 3rd one now is expected to be +157%. That gives a $225 target. The next Top will most likely start a new correction (Bear Cycle) for a 3rd Bottom on the 1W MA200.
## If you like our free content follow our profile to get more daily ideas. ##
## Comments and likes are greatly appreciated. ##

Uber (UBER, 1W) Tightening Structure Ready for BreakoutOn the weekly chart, UBER has formed a strong ascending wedge / tightening channel, showing clear higher lows and repeated rejections near upper resistance. The price is now approaching the apex of the pattern, with a possible breakout setup above $82.42.
If confirmed, the projected measured move (H = $27.67) aligns with Fibonacci extension targets at:
– $89.86 (1.272)
– $93.74 (1.414)
– $99.32 (1.618)
Technical structure:
– Price held support twice, confirming bullish intent
– Structure tightening — breakout likely on sustained volume
– Bullish divergence forming on the weekly stochastic oscillator
– A breakout above $82.42 activates the next impulse wave
– Volume is stable, with no signs of heavy distribution
Fundamentals:
Uber has reached a major financial milestone: consistent profitability and positive EBITDA growth. The company continues to expand across mobility and delivery, with a focus on cost efficiency, platform monetization, and retention. Increased user activity and growing institutional interest support a bullish mid-term thesis. Uber is increasingly seen as a core holding in next-gen tech and services portfolios.
The technical structure is approaching resolution. A confirmed breakout above $82.42 opens the door for a move to $89.86 → $93.74 → $99.32. With bullish structure and improving fundamentals, Uber is positioned for the next leg higher. This is a setup worth watching.

REJECTION OF $292Tesla's stock ( NASDAQ:TSLA ) has faced multiple rejections at key resistance levels. To establish a strong upward trend, it may require forming a triple bottom pattern. This would indicate a solid foundation for potential growth. It is anticipated that the stock will retest the $270 and $250 levels before making a decisive move.
