SMCI Is it still a buy following the Q3 revenue and profit cut?Super Micro Computer Inc (SMCI) cut its third-quarter revenue and profit expectations due to delays in customer spending, amplifying worries of a pullback in AI-linked investments and pushing its shares down -16% pre-market.
It has been 6 months since we issued a major buy signal on SMCI (November 07 2024, see chart below):
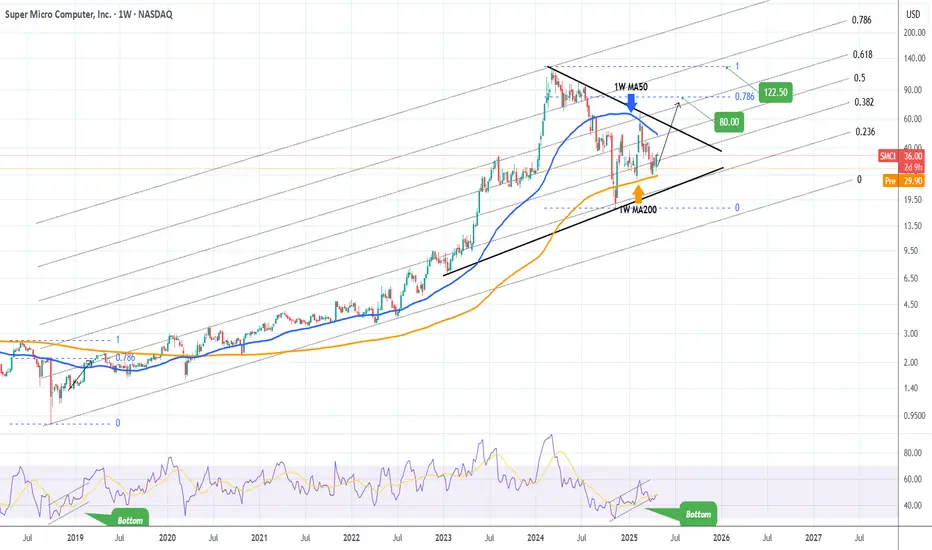
Even tough our $122.50 long-term Target still stands, we have to move it later on the time-line until the economic outlook shows the positive signs of 2024 again.
Until then, we have a more medium-term Target of $80.00, which is on the 0.786 Fibonacci retracement level, the same level the price hit in March 2019, following the first U.S. - China Trade War in 2018.
As you can see, the recovery patterns in terms of 1W RSI between the two fractals are almost identical.
Right now the stock is basically consolidating within the 1W MA50 (blue trend-line) and 1W MA200 (orange trend-line), waiting for the next round of expansion news for the market, to break above the Triangle.
-------------------------------------------------------------------------------
** Please LIKE 👍, FOLLOW ✅, SHARE 🙌 and COMMENT ✍ if you enjoy this idea! Also share your ideas and charts in the comments section below! This is best way to keep it relevant, support us, keep the content here free and allow the idea to reach as many people as possible. **
-------------------------------------------------------------------------------
💸💸💸💸💸💸
👇 👇 👇 👇 👇 👇
Stocks!
btc . month . outlookLONG worked out nicely, BUT there was no SFP liguidity grab at cw/cmHigh
- finished LONG trade with 10pm (+2h tz)
- price dropped below entry . out of LONG . looking for lower new entry
As we're just before a new monthly open, possibility for retrace during Month May enhances
- This would give a nice new SWING LONG entry
- As well as a nice SHORT entry to ride the rotation downwards
Tuesday gave up a couple of SUPPORT levels . got me to shift SHORT for wednesday
- scaling SHORT at fib + cw0.75
Invalidation:
Running stops at 92.750 and recovering above cw0.5

META Share Price Rises Cautiously Ahead of Earnings ReportMETA Share Price Rises Cautiously Ahead of Earnings Report
As shown on the Meta Platforms (META) chart, the share price rose by approximately 1% yesterday. This movement was supported by the announcement of the launch of the Meta AI app—an artificial intelligence-based application that will function as a personal assistant on mobile phones (similar to Google Gemini).
In a different market environment, the news might have prompted a more positive reaction. However, traders currently appear to be exercising caution, as Meta Platforms (META) is due to report its quarterly results after the close of the main trading session today. According to media reports, expectations include:
→ Revenue in the range of $41.35–$41.5 billion, which implies a year-on-year increase of roughly 13–14%.
→ Earnings per share (EPS) between $5.22 and $5.29, indicating a 11–12% rise compared to the same period last year.
Key Factors in Meta’s Quarterly Report
The following areas are likely to have a significant impact on META's share price in the wake of the report:
→ Advertising business , Meta’s primary revenue stream (around 96%). There is a possibility that US tariff policies could prompt major Chinese advertisers—such as Temu—to reduce their advertising spend in the United States.
→ Investment in Artificial Intelligence (AI) and Augmented Reality . Market participants may revise their valuation of the stock downwards if there are lingering concerns over the long-term return on these investments.
→ Forward guidance on revenue and earnings for the next quarter and full year 2025. These forecasts will carry particular weight in an environment of elevated uncertainty linked to US trade policy.
Most Wall Street analysts maintain a “Buy” rating on Meta shares. However, some have lowered their price targets in April, noting that the stock has lost roughly a third of its value since its all-time high in February.
Technical Analysis of Meta Platforms (META)
Price movements earlier in 2025 continued to trace a rising trend channel (shown in blue), with a run of 19 consecutive days of gains in February following upbeat news. However, this trend channel appears to have lost relevance at this stage.
The psychological level of $500 now offers strong support, while the $585 level has turned into resistance. It is reasonable to expect that the earnings report could trigger heightened volatility and a test of one of these key price levels.
This article represents the opinion of the Companies operating under the FXOpen brand only. It is not to be construed as an offer, solicitation, or recommendation with respect to products and services provided by the Companies operating under the FXOpen brand, nor is it to be considered financial advice.

The Dow Jones breaks out of a Symmetrical Triangle patternThe Dow Jones TVC:DJI is breaking out today.
RSI is looking better.
However, the buy volume is weak.
Looking at the money flow reveals this.

What is a war chest and lessons we can learn from Blackstone...In case you haven't heard, NYSE:BX is hogging over $100 billion of dry powder that is ready for deployment at the snap of a finger. Now, just because we cant get our hands on hundreds of billions of dollars doesn't mean that we shouldn't have a war chest of our own.
Why a war chest is a must have
Firstly, having dry powder ready for the next trading day could be the determining factor of a make or break trade. Specifically think back to when the current market downturn started. If I had to guess, many of you reading were far too exposed to the market and got scared from the "red wave" that shocked the market heatmaps. I would also like to bet that many of you sold positions for a loss to stop the bleeding and are now looking for a better entry. However, consider what would have happened if you had spare cash on your side to keep your positions alive.
Here is an example of over exposure.
And here's an example of keeping about a 20% war chest by your side...
I understand that it seems like a small amount of money, but trading is a game of pennies and a winning position of pennies is much better than a losing position of $140. This is the same tactic that firms like Blackstone use to protect large positions from poisonous events such as this recent downturn in the market. So in order to make money like a bank, we need to learn to think like a bank...

Daily Price Action: TSLA Tuesday 4/29/2025In this video, we will be looking into the potential price action TSLA.

DJIA Tests Major Resistance – Reversal or Breakout Next?The Dow Jones Industrial Average is pressing against a key resistance zone near 40,860, the neckline of a double-bottom pattern after rebounding sharply from its mid-April low:
📈 Strong 2-week rally from sub-37K lows
🔵 Price attempting to break the neckline after reclaiming the 50-day SMA
📊 RSI near neutral at 51 – plenty of room to run
📉 MACD accelerating upward, hinting at bullish momentum
If price clears and holds above 40,860, bulls could target a move back toward 42,500–43,000. Failure to break this zone may trigger a pullback toward the 50-day SMA near 41,500.
The setup is constructive — but the bulls need confirmation.
-MW

TALLooks like price is near a support zone dating back between November '24 - January '25. If we look at the two "throw up" emojis price shot down pretty sharp and price started to trade sideways (one on the left) then price retraced a bit before making a new local "potential" support zone if price settles here. Got a big bear volume spike on 4/24/25. Momentum is on a pause right now so I'm interested to see if we get bullish momentum coming in toward the target range located on the chart. If price goes lower, we will look for a second entry if opportunity presents itself.

$BMYLooks like price is near a support range dating back between November and February of 2024. If you look at the "throw up" emoji, there was a nice flat down drop in price and since then, it seems like we are at the brink of possibly starting to gas out a bit for some potential relief. They just came off of good earnings to. I'm looking for a target between $49.48 and $49.86 minimum. Price looks like its gassing out the recent move down. Let's see if we get some buyer in the market or if the Bears close some of they positions.

April 29, 2025 - Waiting for the Crash or the Miracle?Hello everyone, it’s April 29, 2025. Yesterday’s market session was about as exciting as watching paint dry. After months of Trump-fueled chaos, investors seem almost relieved that… nothing happened. Indices barely moved: TVC:DJI up 0.28%, SP:SPX up a pathetic 0.06%, CME_MINI:NQ1! down 0.10%. In short: we’re falling from a 150-story building, and so far, so good — but we know the real pain comes when we hit the ground.
Markets are clinging to hopes that Trump’s trade war with China might get a Hollywood-style happy ending. He’s calmed down a bit. Stopped slamming Powell, flirted with diplomacy, and softened up on auto tariffs. But with an avalanche of critical economic data coming (Consumer Confidence, GDP, PCE, Jobs) and Magnificent Seven earnings, no one’s taking big bets right now. Everyone’s waiting to see if the economic parachute opens, or if we get pancaked on impact.
Meanwhile, US macro isn’t looking great. Confidence is sinking — 53% of Americans say their finances are worsening, a record since COVID. Consumer spending is stalling, companies like NASDAQ:AAL and NASDAQ:DPZ are canceling forecasts, and the real estate market is coughing. Even hardcore Trump supporters are starting to sweat. The US might still technically be growing, but psychologically, the recession has already started.
OANDA:XAUUSD is holding strong at $3,321, BLACKBULL:WTI is around $61.57, and BINANCE:BTCUSDT is cruising near $94,400. Futures this morning are flailing between -0.6% and +0.2%, dancing to the tune of whatever headline drops next.
On the political front, Trump pulled a classic backpedal on auto tariffs: no double penalties for carmakers, partial refunds on tariffs already paid, and promises of time for US production reshoring. Nice words but rebuilding car factories will take years.
As for NASDAQ:NVDA , it’s under pressure after China banned sales of its H20 chips. Huawei’s Ascend 910D chip is stepping in — good for China, but too slow and too pricey for the rest of the world. Nvidia stays king globally for now, but the tech war is heating up.
Today, eyes are on key numbers: US Consumer Confidence (expected 87.7) and JOLTS job openings (expected 7.49M). Also, a heavy lineup of earnings: NYSE:V , NASDAQ:SBUX , NASDAQ:COKE , NYSE:PFE , NYSE:SNAP , and more.
For now, we’re still in free fall, hoping there’s a giant crash pad waiting at the bottom. Hang tight — it’s going to be another wild one.

Tesla Bullish, Let Me ExplainYesterday's high was the highest price since 4-March 2025, almost two months ago. The fact that TSLA moved out of bottom prices and strong long-term support zone while challenging resistance is a bullish signal.
The prices that were activated in Mach and April as support is the same range that TSLA used back in 2024 to launch the previous bullish wave. The same prices as in October and September 2024. The same levels were activated but as a higher low. Clearly a bullish dynamic.
For this setup to be bearish, the action would have to go lower and print a lower low compared to August 2024, this isn't the case. We have a strong higher low which means that buyers were eager to enter the market and waiting for this long-term support zone to be activated. As soon as it was activated buyers showed up and this is confirmed by current price action. Short-term, Tesla is moving up.
This is short-term because a new bullish wave is just now getting started but the fact is pointing towards additional growth.
Yesterday TSLA closed above EMA55 daily for the first after hitting support since October 2024. Once EMA55 gets challenged and conquered, we are looking at the least 2-3 months of bullish action. Don't get me wrong, there can be swings short-term, shakeouts and such but no new lows. The low has been set 7-April 2025, from this point on, we will see growth.
Once a strong resistance level is challenged, we can look at the chart and see if there will be a major correction or just a retrace before additional growth. The truth is that the stock market is set to go higher, TSLA is just one stock. The SPX, NVDA, Bitcoin and many other instruments will grow. Everything will grow.
Namaste.

High-risk, extreme reward event-driven contrarian/squeeze setupBeyond Meat soared in 2019–2021 on blockbuster growth hopes, only to see its stock crater nearly 99% as reality fell short of hype. Sluggish consumer adoption, steep promotional discounts, and margin pressure dragged revenues from a 2020 peak of $419 M into multi-quarter declines. Recently, management has right-sized operations: Q4 2024 net revenues rose 4% YoY, cost-cutting measures are underway, and new product and foodservice partnerships are rolling out—even as the China business is suspended. Trading below 1× forward sales with ~25% short interest, BYND offers one of the most insane high-risk, event-driven contrarian setups I've ever seen ahead of the May 7 Q1 2025 report.
1. Implosion: What Happened?
Peak Hype & Insane Expectations
Investors crowned BYND “the Tesla of food,” pricing in 100%+ growth on only ~$200 M in trailing revenues at IPO.
Missed Growth Targets
2021 sales climbed just 37% to $464 M—well below the ~50% growth forecast—when heavy grocery promotions eroded prices.
Margin Squeeze
Gross margins plunged from ~28% to ~10% as Beyond funded discounts in retail and co-promotions with foodservice chains.
2. Recent Fundamentals & Stabilization
Q4 2024 Turnaround Signs
Net revenues of $83.1 M, up 4% YoY—the second straight quarterly increase after nine declines.
Cost-Cutting Initiatives
U.S. plant scale-ups and supply-chain optimization trimmed per-unit costs; SG&A fell ~8% YoY.
2025 Guidance
Revenues guided to $320–335 M (flat vs. $326.5 M in 2024); management targets adjusted-EBITDA breakeven by Q4 2025.
3. Recent Initiatives & Partnerships
Product Innovation : Fourth-gen Beyond Sausage (avocado oil formulation), “Beyond Sun” links, new pre-seasoned Beyond Steak flavors (chimichurri, Korean BBQ), and Crispy Nuggets for operators.
Foodservice Expansion : Beyond Burger® and Nuggets added to cafeterias and chains; Veggie McPlant Nuggets at McDonald’s France; smash-burger trials at Tesco UK; Wendy’s Georgia plant-based burger in 19 locations.
International Roll-outs : Retail launch of Beyond Steak in France and UK (Tortilla), expanded Europe/Middle East footprint.
Operational Restructuring : Exiting China by mid-2025, laying off ~6–9% of workforce, consolidating co-packers, automating U.S. plants to chase a ~20% gross margin.
4. Valuation & Sentiment
Trading at ~0.9× forward sales vs. peers at 1.5–5×.
Short interest ~25% of float—one of small-cap’s highest.
China exit & layoffs a margin catalyst; gross margin goal ~20% in 2025.
New products and foodservice deals reinforce R&D and growth narrative.
Q1 2025 earnings (May 7) could ignite a squeeze.
Catalysts
Q1 2025 earnings (May 7) beat/guide-up.
Roll-out of new sausage, steak & nugget products at major retailers.
Further high-profile partnerships (Starbucks, Yum! Brands).
Final words
Beyond Meat’s meteoric rise and fall reflect expectations that outpaced execution. Today, early signs of revenue stabilization, aggressive cost cuts, product innovation, and a clear path to break-even—combined with a sub-1× sales valuation and sky-high short interest—create a classic event-driven contrarian opportunity. The May 7 Q1 2025 report is the next major inflection point.

btc . tue . recap plan to LONG came to fruition
LONG note:
as i found wOpen heavily BULLISH - i was eager to get in early and equaly positioned:
cw0.5 . 94.200
to
cw0 . 92781
entry: 93.975
this left me with not the nicest entry . not all orders were filled . should have favoured increasing order size . one never really knows until it happens . but happy
DAY TRADE note:
a day trade of nysOpen SFP . 95.400 (to ride down for our LONG IDEA)
LONG SUPPORT will show during the day . NICE! . but not taken . it supported our search for LONG though
recap
wOpen . ASIA . LONG
nysOpen . SFP to 5.30pm . LONG
tueOpen . ASIA take profit . rotation to cw0.5 . (LONG in favour)
nysOpen . idealy tp1 : SFP . possibly rotation . (look out for SHORT and LONG)

GBP/USD - Watch out for a possible rejection!The British pound is currently moving towards the upside, showing a gradual but steady climb. However, it is approaching a significant resistance area that could pose a challenge to further gains.
-------------------------------
Double top
This resistance zone was previously a strong support level before the market formed a double top pattern and subsequently broke below it. As is often the case in technical analysis, this former support has now flipped into resistance, making it a key area where price could face strong selling pressure and potential rejection.
-------------------------------
1h FVG
Adding to the confluence, this resistance zone aligns closely with a 1h Fair Value Gap (FVG). FVGs often attract price back into them before a reaction occurs, making this area even more significant for a potential reversal.
-------------------------------
Golden Pocket
Just below the FVG lies the "Golden Pocket", the 61.8% Fibonacci retracement level from the most recent drawdown. The Golden Pocket is one of the most closely watched Fibonacci levels by traders and is known for its strong influence on price action. Its proximity to the current structure increases the likelihood of a notable reaction, as many market participants will be watching this area closely for signs of rejection.
-------------------------------
Conclusion
Overall, the combination of previous support-turned-resistance, the 1-hour FVG, and the Golden Pocket retracement forms a high-probability zone where the British pound could encounter heavy resistance and a potential downside move.
-------------------------------
Thanks for your support.
- Make sure to follow me so you don't miss out on the next analysis!
- Drop a like and leave a comment!

is selling being absorbing near 23350 level ?yesterday 27 April I mentioned that nifty must have to break & sustained 23350 level it happened today but long upper wick on hourly time with high volume been noticed showing selling pressure in market of course market bullish momentum still intact it respected the near 23800 level trading above 20 EMA but we need to wait more multiple testing for confirmation to continue upside journey so consolidation may happen in 2-3 days.

Google Ruling Could Be Very Bullish for TTDA U.S. judge has found Google guilty of illegally monopolizing the digital advertising technology markets. The monopolization of both the demand and supply sides has been a long-standing concern for the rest of the digital advertising sector.
This ruling may significantly benefit The Trade Desk (TTD), as it operates as an independent demand-side platform. The digital advertising market is projected to exceed $600 billion in 2025, and Google currently believed to be controls nearly 30% of that. Even a 5% slip in Google’s market share, with TTD capturing just 10% of that shift, could nearly double TTD's revenue. As a result, this ruling is can be considered very bullish for TTD, both in the medium and long term.
Technically, TTD recently tested the $40 level, a key support that has held since Q4 of 2020, indicating the stock is currently in a strong demand zone. With this news, the likelihood of that support holding and a bullish reversal increases.
Analyst consensus reflects an 85.8% upside potential. If the bullish scenario plays out, the horizontal level at $60 and the 200-day moving average could serve as key medium-term targets. From current levels to the 200-day SMA, the potential return is close to 50%.

Nightly $SPY / $SPX Scenarios for April 29, 2025🔮 Nightly AMEX:SPY / SP:SPX Scenarios for April 29, 2025 🔮
🌍 Market-Moving News 🌍
🇺🇸 Anticipation Builds for Key Economic Data: Investors are on edge as they await a series of critical economic reports this week, including GDP growth figures and the April jobs report. Concerns are mounting that recent tariff policies may have begun to weigh on economic performance, with forecasts suggesting a significant slowdown in growth.
💼 Earnings Season in Full Swing: Major corporations are set to report earnings today, including AstraZeneca, Honeywell, Regeneron, PayPal, PACCAR, Kraft Heinz, Ares Capital, SoFi, Zebra Technologies, Incyte, Repligen, and Commvault. Investors will be closely monitoring these reports for insights into how companies are navigating the current economic landscape.
📉 Market Volatility Persists Amid Trade Tensions: The stock market continues to experience volatility as investors grapple with the implications of ongoing trade disputes and tariff implementations. Analysts warn that prolonged trade tensions could further dampen economic growth and corporate profitability.
📊 Key Data Releases 📊
📅 Tuesday, April 29:
📦 Advance Economic Indicators (8:30 AM ET):
Includes data on international trade in goods, wholesale inventories, and retail inventories for March. These figures provide early insights into trade balances and inventory levels, which are critical for assessing economic momentum.
📊 Consumer Confidence Index (10:00 AM ET):
Measures consumer sentiment regarding current and future economic conditions. A decline in confidence could signal reduced consumer spending, impacting overall economic growth.
💼 JOLTS Job Openings (10:00 AM ET):
Reports the number of job openings, indicating labor market demand. This data helps assess the health of the job market and potential wage pressures.
⚠️ Disclaimer: This information is for educational and informational purposes only and should not be construed as financial advice. Always consult a licensed financial advisor before making investment decisions.
📌 #trading #stockmarket #economy #news #trendtao #charting #technicalanalysis

BTC - 4 Cycles Repeating Itself!Hello TradingView Family / Fellow Traders! This is Richard, also known as theSignalyst.
The picture says it all!
🔄Is history about to repeat itself?
If so, we are currently in Phase 2. 📈
What’s next? A dip toward the $75,000 zone is expected before the next impulsive move begins. 📉🚀
📚 Reminder:
Always stick to your trading plan — entry, risk management, and trade management are key.
Good luck, and happy trading!
All Strategies Are Good, If Managed Properly!
~Rich

Coinbase Global (COIN) – Bridging Crypto and Traditional FinanceCompany Snapshot:
Coinbase NASDAQ:COIN is cementing its role as the gateway to the crypto economy, offering secure trading, custody, and institutional-grade financial services—positioning itself for expansion well beyond retail.
Key Catalysts:
Bank Charter Ambitions 🏦
Exploring a bank charter, potentially evolving into a full-service financial institution
Would diversify revenue and boost regulatory credibility, key in the maturing crypto sector
Institutional Growth Momentum 📈
Extending credit to major players like CleanSpark
Building sticky, high-value relationships and reducing retail dependency
Strengthening Financials 💰
14.8% pre-tax margin
39.16% profit contribution margin → Clear operating leverage and path to sustainable, scalable profitability
Trusted Brand Advantage 🛡️
Strong institutional trust + regulatory compliance reputation → defensible moat in a volatile industry
Investment Outlook:
✅ Bullish Above: $160.00–$162.00
🚀 Target Range: $280.00–$290.00
🔑 Thesis: Regulatory expansion + institutional scale-up + financial efficiency = long-term crypto-finance powerhouse
📢 COIN: Not just a crypto exchange—an evolving financial institution for the digital future.
#CryptoFinance #Coinbase #DigitalAssets #Fintech #InstitutionalGrowth #BankingFuture

3 Oversold Stocks Poised for a Rally – MAS, IQV & TMOBelow is today’s SmartApingAI snapshot of three highly oversold names showing early signs of a rebound. Scroll down for a quick refresher on each company’s fundamentals, key technicals, and what makes them attractive at current levels.
1. Masco Corp ( NYSE:MAS )
What They Do:
Masco designs, manufactures and sells a broad range of home-improvement and new-construction products, including faucets, cabinets, hardware, coatings and architectural products.
Customers:
• Homeowners tackling renovation projects
• Professional contractors and builders
Income Source:
Primarily through the sale of mid-range to premium fixtures, cabinetry systems and paint/coatings.
Geographic Footprint:
• ~85% North America
• ~15% Europe
Product Pricing:
Mid-range to premium, with strong brand recognition in kitchen and bath fixtures.
SmartAping AI Model Target Price:
$81.36
Technical Snapshot:
• Broke below—and then bounced off—the $57 weekly support zone
• Now trading at $60.42, up from the intra-week low
• WiseStrat Macro ASI: deeply oversold at –120, turning bullish
• WiseStrat Micro ASI: still bearish, suggesting cautious position sizing
Why Watch:
Home-improvement spending has held up despite moderating housing starts, and MAS’s disciplined balance sheet and dividend yield (~2%) make it a compelling recovery play if consumer confidence picks up.
2. IQVIA Holdings Inc ( NYSE:IQV )
What They Do:
IQVIA provides data analytics, research services and technology solutions that power clinical trials, market research and real-world evidence for the life-sciences industry.
Customers:
• Pharma and biotech firms
• Medical device companies
• Healthcare providers and payers
Income Source:
Subscription and project-based fees for data platforms, consulting and trial execution services.
Geographic Footprint:
• 50% Americas
• 30% EMEA (Europe, Middle East & Africa)
• 20% Asia-Pacific
Product Pricing:
Variable, tailored to project scope—from high-volume data subscriptions to multi-million-dollar trial outsourcing contracts.
SmartAping AI Model Target Price:
$275.35
Technical Snapshot:
• Dropped below the $137 weekly support last week, then staged a relief rally
• Currently at $150.28
• WiseStrat Macro ASI: extremely oversold at –127, now in bullish reversal mode
• WiseStrat Micro ASI: turning positive, hinting at building short-term momentum
Why Watch:
With global R&D spend on track to exceed $250 billion this year, IQVIA’s blend of analytics and CRO services is in high demand. A seasonal uptick in trial starts could catalyze upside toward our $275 target.
3. Thermo Fisher Scientific Inc ( NYSE:TMO )
What They Do:
Thermo Fisher supplies scientific instruments, reagents and software used in research, diagnostics, manufacturing and safety testing across life-sciences and industrial markets.
Customers:
• Academic, government and corporate research labs
• Clinical and diagnostic facilities
• Biopharma manufacturers
Income Source:
Sales of equipment (from a few hundred to multi-million dollars), consumables, and service contracts.
Geographic Footprint:
• ~50% North America
• ~30% Europe
• ~20% Asia-Pacific & other
Product Pricing:
Ranges widely: entry-level lab kits to high-end sequencers and complete lab automation lines.
SmartAping AI Model Target Price:
$645.83
Technical Snapshot:
• Tested and held the $412.73 weekly support last week, bouncing back to $424.24
• WiseStrat Macro ASI: oversold at –129, now showing bullish tilt
• WiseStrat Micro ASI: still negative, cautioning potential retest of $412
Why Watch:
Strong long-term secular drivers—gene therapy, personalized medicine and diagnostics—remain intact. A washout in biotech funding fears has left TMO trading at a rare discount to growth peers.

TSLA: Low Is In , Rally IncomingTSLA is showing signs of strong accumulation, with buyers consistently stepping in and volume expanding on up-moves. Price structure is improving, breakouts further confirm strength, increasing the likelihood that bears have been left behind. Based on the price action and volume alone, TSLA looks ready for a potential sustained move higher.

S&P 500 Rally Exhausted? Watch This Level for the Next Drop!The S&P 500 Index( SP:SPX ) has finally touched the Resistance zone($5,680-$5,500) as I expected in my previous post .
The S&P 500 Index is moving near the Resistance zone($5,680-$5,500) , the Resistance line, and Yearly Pivot Point .
Also, we can see the Regular Divergence(RD-) between Consecutive Peaks .
In terms of Elliott Wave theory , it seems that the S&P 500 Index is completing the Zigzag Correction(ABC/5-3-5) , and if the uptrend line breaks , we can confirm the end of the Zigzag correction .
When the S&P 500 Index started to rise on April 22 , Bitcoin also started to rise at the same time , so a decline in the S&P 500 Index can cause Bitcoin ( BINANCE:BTCUSDT ) to decline .
I expect the S&P 500 Index to drop to at least $5,313 AFTER breaking the uptrend line .
Note: If the S&P 500 Index touches $5,712, we can expect more pumps.
Please respect each other's ideas and express them politely if you agree or disagree.
S&P 500 Index Analyze (SPX500USD),2-hour time frame.
Be sure to follow the updated ideas.
Do not forget to put a Stop loss for your positions (For every position you want to open).
Please follow your strategy and updates; this is just my Idea, and I will gladly see your ideas in this post.
Please do not forget the ✅' like '✅ button 🙏😊 & Share it with your friends; thanks, and Trade safe.

JP MORGAN's long-term bullish trend restored above the 1D MA50.JP Morgan Chase (JPM) broke above its 1D MA50 (red trend-line) last week for the first time since the first week of March and technically put an official end to the 3-month 'Trade War' correction.
This correction has technically been the Bearish Leg of the 2.5-year Channel Up. Every time the 1D MA50 broke and closed a 1W candle above it, the stock started the new Bullish Leg of the pattern. The last Bullish Leg was +6% (+48% against +42%) stronger than the previous one before the first pull-back to the 1D MA50 again.
As a result, we expect to see $310 (+54%) before this year is over.
-------------------------------------------------------------------------------
** Please LIKE 👍, FOLLOW ✅, SHARE 🙌 and COMMENT ✍ if you enjoy this idea! Also share your ideas and charts in the comments section below! This is best way to keep it relevant, support us, keep the content here free and allow the idea to reach as many people as possible. **
-------------------------------------------------------------------------------
💸💸💸💸💸💸
👇 👇 👇 👇 👇 👇
