MY APPROACH TO MAKING MONEYMy main trading principle is that the price always moves from swept liquidity levels to untouched liquidity levels by forming structure on the way.
Liquidity and Structure is a key for my trading system.
Structure-trading

Bull/bear idea I will open a sell on bitcoin below 16,517 and risk 1% of my account value to make 3% And close out .
I will open buys on bitcoin if we break above 17,121 and risk 1% of my account value to make 3%.
I will watch this trade idea for the next 23hrs .

SupportIF Gold falls below from here it will first aim for 1784 - 1780 Support level . From there Price Action will decide our trading decision. Wait for this support to hit. then watch out if it holds or not. I will comment on this one as its unfolds.
If you like my contributions please like and subscribe and also spread my work by sharing if you thinks is worth it. Thanks.

EUR-USD Structure Analysis! Where To Buy?
Hello,Traders!
EUR-USD seems to be in a free-fall
Which to me is an overreaction to the FOMC meeting results
And looking at the 1D chart of EUR-USD I see 2 potential reversal levels
One,being the low of the previous move down at 1.171
And the second one-a massive structure support at 1.161
The first one is newer, the second one has two touch-points
Thus both are likely to stop the fall and produce a bullish correction
Which I think will be strong and rapid
So we are waiting patiently for the pair to reach any of the two levels
And then we will be looking for the reversal signs before jumping on the correction bandwagon
Buy!
Like, comment and subscribe to boost your trading!
See other ideas below too!

AUDCAD Short - 1HR TF bearish trend continuationHi, guys I hope that you are all well!
Typically at this time of year markets generally quite down due to Christmas approaching, however we are seeing some strong moves in the market across my portfolio and AUDCAD happens to be one of them.
What I am looking for is bearish trend continuation following a pullback up into the most recent area of consolidation/range in anticipation for sellers to step back into the market and make one final retest of the lows at .9570's.
So far price action has tested this area/kill zone a few times and buyers continue to find resistance.
RSI has also gone OB (80) but I am still yet to get an entry myself as price action has not yet formed a valid LLLC candlestick within the identified kill zone and until I have the entry reason I cannot enter just yet.
We do also have some FIB confluence within the kill zone to add further reason for why sellers could step back into this market and the next level of structure support being down at lows of .9560's
I will continue to monitor this pair and hopefully I will get my entry reasons met and able to get involved in the trade itself.
Trade with confidence,
Henri W.

Trade Ideas Position: Gold GartleyNot the best bearish Gartley I would be trading, just look at Pt C touches the closing price of Pt A, make it a retest of Support.
If the market did not have a series of lower-high.
I will have to see how the candle close and form up at Point D before engaging the trade.
Stops above X will be above of the lower-high trendline.
Exact Entry, Stops and Targets will be share to my subscriber.
In just the month of Oct, we shared a total of 2,333pips of net profit.
In order not to miss another great trading ideas again, just subscribe to us at the link below:
forex100academy.com


2 possibilities in my opinion - wait for possible entry signalLooks like after a long imprulse the bears managed to retrace up to 50% - the bulls now are trying to recover from the bear impulse but with not much strength as it seems so we could be heading to the downside

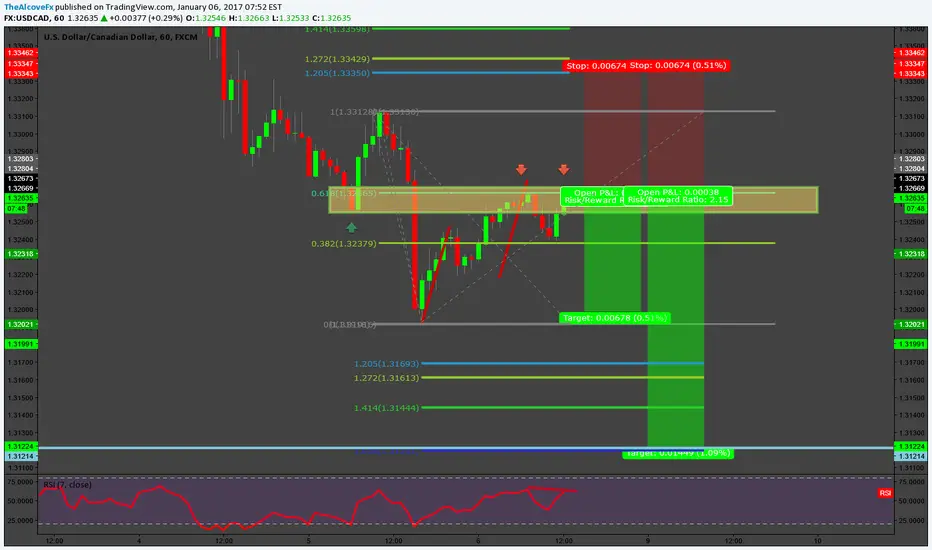
USDCAD Long Trade SetupHey guys,
just a short trading setup. We took a long position at around 1.3325 with a stop loss at around 1.33033 and initial target of 1.3387.
This trade is just a range play. BUT why the position we haven taken is because of structure and Intermarket reasons, so we didn't just bought it randomly there is a strategy and structure technique behind it. For more see our signature.
So we are bullish short term the USDCAD lets see whether it play out or not. As always never over leverage and always use a stop loss while trading and never risk more than 1% on each trade.
Cheers

Why USDJPY Could Move Lower..Hello Traders,
we hope you had a successful trading week. In this short update, we wanted to talk about the USDJPY and why it could move lower thru out next week.
After the market rose about 17.09% in last years impulsive to the upside, the USDJPY was in a sideways trend for weeks.
Now the market broke its key level of 111.476, which could open up an extension lower to around the last resistance now acting as new support at around 107.456. With the health bill rejected today, we could see throughout risk equity weakness next week. Which would consist with USDJPY trading lower on risk aversion.
If we don't see any significant fundamental changes throughout next week, were going to search for short opportunities in USDJPY, especially with the break of the important resistance.
We will keep you updated on this one. We wish you a relaxed weekend. Trade with care and always use a stop loss while trading and don't overleverage, otherwise you will lose your account!
Cheers

Bullish Bat Pattern for possible Wedge Breakout!Hey gang,
got myself involved in the bullish bat pattern @ 1.0762
Looking for Targets at previous highs around 1.0815 area.
A lot of support in this zone (61,8 retracement, structure, channel etc.)
Trade your plan!

Counter Trade Trade on AUDCADI doubt you will be able to look at the level of structure I am referring to in this idea, but you can always open a chart if interested in seeing it. We are coming from a big rally, and we paused at this level. I would have gone short on Friday, but I didn't because of Trump's inauguration. I didn't want to be exposed during the inauguration nor in the weekend. However, I was able to enter today on the 6pm candle close.
We had been looking at this opportunity in the Live Room last week. If you are interested, my mentor run through this opportunity in the video he uploaded a couple hours ago: www.youtube.com

USD/CAD Shorting OpportunityHey traders !
So as we wait for our EURGBP trade to unfold, There is something else on the radar that we can be taking advantage of. This is a structure trade using some simple tools to validate and confirm the trade. The trading opportunity comes from the bearish outlook on the trading timeframe, and recent bearish sentiment on the daily timeframe + the correlation of USDCAD and black crack(oil) adds it to my bearish bias, we start looking for bearish opportunities.
(BTW we do this everyday inside of Forex TV our live trading room)
In this one, its pretty simple, price broke levels of support, and now its coming back up to retest and resistance. We put in a 1 to 1 measured move, we have fibonacci confluence with s/r and if price is able to give a valid double top which its forming right now, we might have our candlestick entry technique to get in the trade(just waiting on that divergence from the RSI).
The targets for this trade are going to be at the previous support and then we are also predicting a longer move to the downside atleast up till the 1.618 which lands right above a previous support look alllll the way left.
Like always, if you have any questions feel free to comment below

EURGBP Short - Structure TradeEURGBP price action has hit its highest level since 2013 and now is going through a significant retracement. Would be looking for a retracement ideally to the 886 level where price action has found support previously. But also watching for any reasons for entry at the 786 level.

Gartley pattern on AUDUSDThe last two patterns were losers, and I took a relatively big loss on them. But, that doesn't mean that I have to scare myself out of the next opportunity! It doesn't matter if it wins or not as long as I am following the plan! ...I hope it wins though haha.
I hope you all are having a wonderful week of trading!

GBPJPY Double Bottom Daily ChartWe have come back down to a previous rear of support on the daily charts.
With the wick on the cuirrent candle we have rejected a push lower and I feel we will see mroe upside during the coming week/s
Good Luck

Crude Oil short DailyHere we have the daily chart following the monthly. This chart clearly shows the retest of long term Counter-trendline and also rejection off the 61.8% fibonacci level. Waiting for the daily TL will provide the optimal risk:reward to go short.

EURUSD: Simple Structure ShortNothing fancy here, just short at structure
Akil Stokes
Chief Currency Analyst & Head Trading Coach
www.TradeEmpowered.com -The Premier Online Trading Education Company
YouTube goo.gl
Facebook: goo.gl
Twitter: goo.gl
@AkilStokesRTM (Instagram, Periscope, Snap Chat & StockTwits)

NZDUSD / 1HR / POTENTIAL 2-618 TRADE2-618
PAIR: NZD/USD
TIME-FRAME: 1HR
TRADE: 2-618
Here we are in another brand new week of Trading.
Waiting for a shorting opportunity at the 618% for a
Potential 2-618% Trade.
NOTE: These are potential trade opportunities. Please
re-analyse the trade before executing.
Star Prosper
Philip Stewart
WEBSITE: www.StarProsper.com
FACEBOOK: facebook.com
YOUTUBE: www.youtube.com

EURUSD: Bat PatternOn FX:EURUSD , the market has no direction bias. It moves sideways, where Bat pattern appears, which is a great opportunity for entry. This set-up gives us nice risk/reward.
As it can be seen that, the price already hit D leg at 88%, retraced the market. Aggressive traders can enter market, while more conservative traders wait patiently to make double top at 88% and then enter.
T1 - 382%
T2 - 61.8%

GBPAUD: Bullish Bat, Another Chance at SupportDescription is in the Video: :Do you Accept This Challenge? www.youtube.com

Simple structure trading scores 100 pipsSometime, you don't have to use advanced patterns and fancy indicators. Simple structure analysis can make you profitable if you know how to trade it.
This Elite Zone's structure based setup scored 100 pips today.
Elite Zone members received trading ideas which generated close to 1000 pips this week, not including this one.
If you like what you see, why don't you try signing up for the Elite Zone
See you in the Zone
www.themarketzone.net
