EURUSD WEEKLY TRADE UPDATEhello trader
quick recap frm last week
The euro-dollar is consolidating in a range between 1.09295 and 1.08350 before making fresh lows at 1.08022 and 1.11433, respectively, and finishing the week at level 1.07924 and breaking the uptrend stucture
Currently, the euro-dollar is trading lower, and I expect a support at level 1.07119.
Given that there have been numerous rejections at that level in the past, breaking the support level could push prices farther lower, all the way to 1.0629.
My trading strategy isn't intended to be used as a signal service. It's a process of gaining knowledge of market structure and improving my trading abilities.
Like and subscribe and happy trading to all
Support_and_resistance

GBPJPY DAILY TRADE IDEA
GBPJPY is still consolidating. As long as the price does not make a new low, I believe it is a good time to buy a dip.
My trading strategy isn't intended to be used as a signal service. It's a process of gaining knowledge of market structure and improving my trading abilities.
Like and subscribe and happy trading to all

USDJPY WEEKLY PLAN UPDATEHi all
I was aiming for a 50% retracement between the high (151.946) and the low (127.220). but in order to move higher or back down to the 128 level, resistance at 131.580 must be broken.
Happy weekend
My trading strategy isn't intended to be used as a signal service. It's a process of gaining knowledge of market structure and improving my trading abilities.
Like and subscribe and happy trading to all

AMZN WEEKLY TRADEHello
fundamental issue
job cuts
company stability
underpaid
My trading strategy isn't intended to be used as a signal service. It's a process of gaining knowledge of market structure and improving my trading abilities.
Like and subscribe and happy trading to all

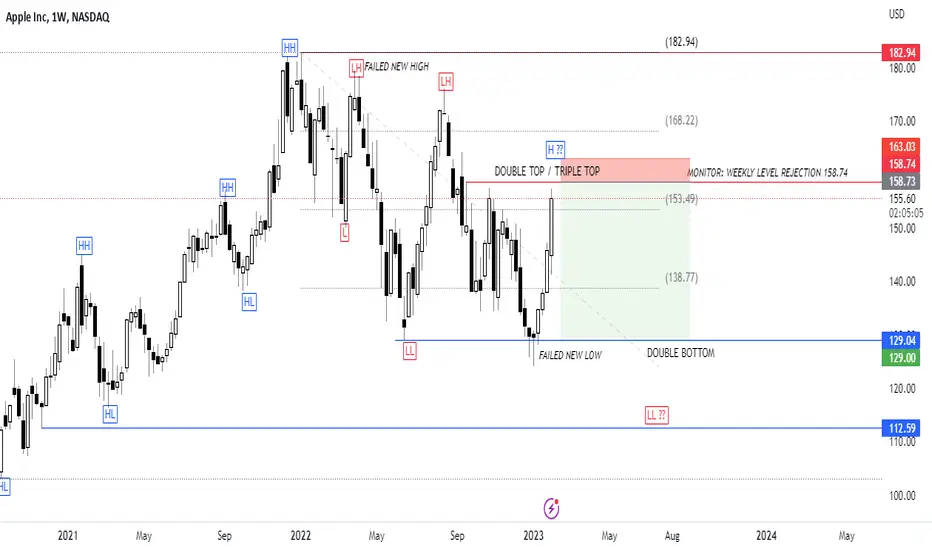
AAPL MONTHLY TRADEHi
After falling from 182.94 and reaching 50% retracement, the AAPL is currently in a downtrend. Not sounding good if key level 158.74 failed to hold
Happy weekend
My trading strategy isn't intended to be used as a signal service. It's a process of gaining knowledge of market structure and improving my trading abilities.
Like and subscribe and happy trading to all
S&P 500 MONTHLY TRADE Hi all
After falling from 4818.62 and reaching 50% retracement, the S&P is currently in a downtrend. There are still three weeks left to determine if the market will turn south or north, as long as 4146.88 holds. S&P could return to 3491 or 3818.
My trading strategy isn't intended to be used as a signal service. It's a process of gaining knowledge of market structure and improving my trading abilities.
Like and subscribe and happy trading to all

SQ - Update - Potential ReversalSQ has been holding a downtrend for quite some time now; with buyers stepping in heading into earnings, we could see a nice bullish reversal coming and a breakout of the downtrend. Square's holding a massive falling wedge on the weekly timeframe, accompanied by some bullish hidden divergence on the RSI, Bollinger bands squeezing, and a huge bullish cypher harmonic pattern. Additionally, an inverse head and shoulders has formed on the 4-Hour timeframe (See Attached Charts Below). Similarly, on the daily timeframe, SQ is within a symmetrical triangle with some bullish hidden divergence on the RSI and a bullish Gartley harmonic pattern. Bullish and will be watching closely for a breakout from this wedge and triangle as buyers continue to step in (broader market conditions & earnings permitting)- Just some support and resistance levels along with some RSI-based supply and demand zones to keep an eye on in the meantime. **See Below for Price Targets, Weekly Timeframe, and Previous Charts**
PT1- $73.87
PT2- $78.82
PT3- $81.03
PT4- $86.76+
--Weekly Timeframe--
- Falling Wedge
- Bullish Harmonic Formed on the Daily & Weekly Timeframes
- Bollinger Bands Squeezing
--4-Hour Timeframe--
- Inverse Head and Shoulders
- Bullish Hidden Divergence on the RSI

GBPJPY TRADE IDEAwaiting for the downtrend structure to break
My trading strategy isn't intended to be used as a signal service. It's a process of gaining knowledge of market structure and improving my trading abilities.
Like and subscribe and happy trading to all

EURJPY WEEKLY TRADE Hi traders,
Same goes with EURJPY is still moving within the consolidation area between the lowers 142.939 and the high 142.939.
The market ended the weekend with a high of 140.754and a low of 159.587.
still waiting 140.620 or 140.297
My trading strategy isn't intended to be used as a signal service. It's a process of gaining knowledge of market structure and improving my trading abilities.
Like and subscribe and happy trading to all

EURUSD DAILY TRADE Hi all
As of right now, what I can tell is that there is a whipsaw pattern before the peak, with the highest price being 1.09308 and the lowest being 1.08350.
I'm interested in trading at the levels 1.09031 and 1.09308. Before reentering the market, watch for a rejection at the 1.098533 level if the peak is broken.
Share your thoughts
My trading strategy isn't intended to be used as a signal service. It's a process of gaining knowledge of market structure and improving my trading abilities.
Like and subscribe and happy trading to all

GBPUSD TRADE IDEAHello traders
Waves 3 and 5 from the two preceding cycles both ended with divergence rather than truncation.
Therefore, given the current price, we are once again looking for a divergence to occur or for a textbook Elliot wave truncation or a fomc kiss the price and hit all SL to move downward.
so share your thoughts
My trading strategy isn't intended to be used as a signal service. It's a process of gaining knowledge of market structure and improving my trading abilities.
Like and subscribe and happy trading to all

XAUUSD : SWING TRADE hello traders
I'm looking for a 50% retracement after rocket up from the low of 1676.866 and the high of 1949.260.
My trading strategy isn't intended to be used as a signal service. It's a process of gaining knowledge of market structure and improving my trading abilities.
Like and subscribe and happy trading to all

USDJPY WEEKLY TRADE Hello traders
I'm looking for a 50% retracement after falling from the high of 151.946 and the low of 127.227.
My trading strategy isn't intended to be used as a signal service. It's a process of gaining knowledge of market structure and improving my trading abilities.
Like and subscribe and happy trading to all

USOIL WEEKLY TRADEHello
Last week's price broke the level of consolidation at 81.44, so let's see if 77.76 will hold or if it will drop to 71.
Share your thoughts
My trading strategy isn't intended to be used as a signal service. It's a process of gaining knowledge of market structure and improving my trading abilities.
Like and subscribe and happy trading to all

LAC - Update - BreakoutHave had my eye on LAC and the lithium sector for quite some time now, and some big news coming this week for LAC while simultaneously setting up for a breakout. LAC is currently holding a massive falling wedge on the daily and weekly timeframes. On top of that, LAC has some slight bullish hidden divergence on the RSI after being way in oversold territory, a double bottom, and MACD golden cross, all accompanied by a bullish cypher harmonic pattern on the daily timeframe (Not Pictured), and lastly some bullish hidden divergence on the RSI on the weekly timeframe. Bullish and will be looking for a breakout from this wedge (Broader Market Conditions Permitting)- Just some support and resistance levels to keep an eye on along with some RSI-based supply and demand zones in the meantime -- Price Targets & Previous Charts Attached In Description -
PT1- $20.81
PT2- $21.67
PT3- $22.54
PT4- $23.78
--Weekly Timeframe--
-- Previously Charted--

Bitcoin Market Recap: Bullish Monthly Close and a Range-Bound PABitcoin has witnessed a bullish monthly close after several months of bearish and sideways price action. This doesn’t mean that the 6-month trading range has been lost or that we are trading outside of it. Yesterday, we saw a critical level, the Value Area High of the 6-month range, which acted as initial resistance. Our old daily level of $22,393, which previously served as support, came back into play and provided support once again. The price then moved into the Value Area Low of the current range and has been ranging between the Value Area High and Point of Control ever since.
Today, a new daily Naked Point of Control was established at the $23,180 level. Initially acting as resistance, we got Swing Failure Pattern from the monthly level and were accepted back into the level. As of now, the price continues to range within the established boundaries.
Tomorrow is an important day for the financial markets with the Federal Open Market Committee (FOMC) interest rate hike meeting and high-tech earnings reports. These upcoming statistics have the potential to impact the value of Bitcoin and other cryptocurrencies. If the monthly level holds and acts as support, we can expect the price to reach the $25,211 level, where our first resistance can be a new daily level of $23,745.5. On the other hand, if the price fails to hold the monthly level, we can anticipate a sell-off with the first support level at $22,287. In the worst-case scenario, if there is no SFP, we expect the price to drop to single prints and reach between the $21,000 - $20,500 level. Tech stocks earning reports can also act as a catalyst for price action, with the following support level expected to be at the $19,000 zone where the Point of Control of the entire range is located.
In conclusion, my strategy will be to trade within the established range until a break occurs. I will carefully monitor the price action and market reactions after the FOMC meeting and earnings reports. As we have traded these levels multiple times, they may become weaker, so I will be cautious and avoid setting pre-set orders. I will only trade while keeping an eye on live order flow.

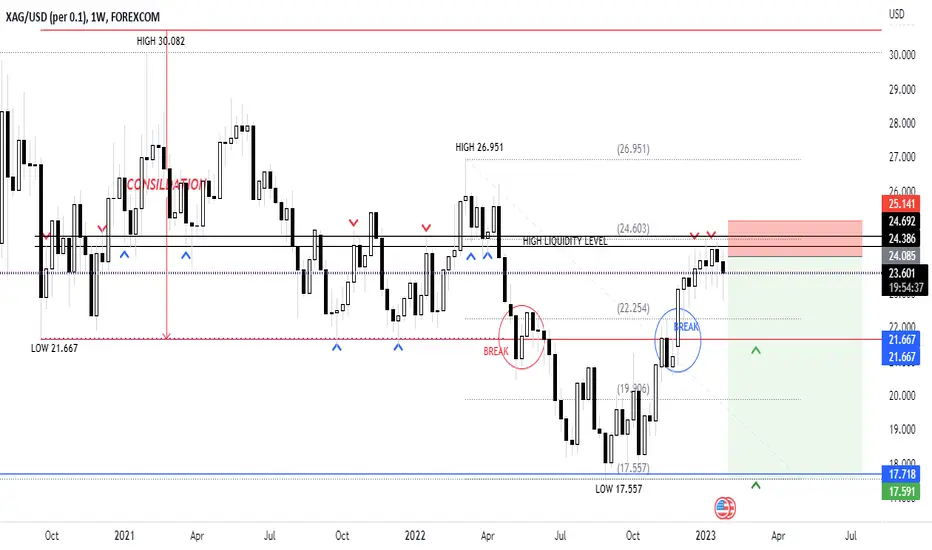
XAGUSD WEEKLY TRADE IDEAHi trader
Silver ends with a low of 17.55 after breaking consolidation at 21.66. There was a lot of liquidity between buyers and sellers between 24.6 and 24.30, and the price is currently close to the 0.764 fibo retracement.
so, I intend to sell, with 21.66 as my first target. ratio 1 : 2
Share your thoughts
My trading strategy isn't intended to be used as a signal service. It's a process of gaining knowledge of market structure and improving my trading abilities.
Like and subscribe and happy trading to all
An In-Depth Look at the Dynamic Bitcoin Price Action on January In the world of cryptocurrency trading, today was a highly intriguing day. Our predicted scenario played out beautifully as we saw the bitcoin price drop to the $22,950 level zone where multiple confluences converged. We saw a bearish (CVD) playing out exceptionally well, and then we saw the price push up to the monthly level before getting rejected and falling back within the range. Throughout the day, the price fluctuates within the range between the Value Area High and Point of Control, finally falling below the Value Area Low just before the NY close. Currently, the price is hovering between the Point of Control and Value Area Low, with the weekly Naked Point of Control at $22,860 and the Naked Session Point of Control at $22,480, both being tested.
Looking at past price behavior, we can see a similar fractal in the price drop toward the Value Area Low before a sharp increase from the $20,500 zone to the $22,500 zone. The first sign of weakness would be a break below the $22,287 level and its eventual rejection as support. In such a scenario, we can expect the price to drop back to the $20,500 zone.
However, the price will only be considered bearish if it falls outside the Value Area High and monthly level. If these levels hold support, we can expect the price to rise to the weekly $24,297 level or even reach the maximum pain scenario for late shorts at $25,211. It's important to note that we are still in the same range, and bitcoin has a history of prolonged periods of range-bound trading.
Additionally, the upcoming Federal Reserve interest rate hike meeting on February 1st, 2023, and earnings reports from companies like Apple, Amazon, and Google, will be significant factors in determining the future direction of Bitcoin's price. Keep a close eye on how the stock markets react to these events.

The Weekend Market: An Analysis of Bitcoin Price MovementsOver the weekend, the bitcoin price experienced another $1000 rise. The bullish sentiment among weekend traders caused the price to break through the monthly level of $23,301 and reach new heights. Currently, the price ranges below the weekly level of $24,297.5 after front-running the weekly naked point of control at $23,970 with a $3 margin.
The direction of today's price action will be heavily influenced by the performance of the stock market and the US Dollar Index (DXY). From previous price movements, we can observe that the DXY is showing signs of weakness, while both the S&P 500 Index (SPX) and bitcoin are demonstrating strength. This suggests that we see a continuation of these trends.
Based on this analysis, there are three potential scenarios for the future of the bitcoin price.
Scenario 1: Bitcoin may experience a dip down to test the monthly and new daily levels at $23,021. At this level, there is a confluence of factors, including the point of control for the entire range, a 0.618 Fibonacci level, and a new daily level. This dip may give the market a sense of acceptance within the current range, trap late shorts, and prompt a continuation of the upward trend.
Scenario 2: The price may hover above the monthly level and continue upward, eventually reaching the weekly level of $24,297.5. This would signify a continuation of the current bull trend.
Scenario 3: Alternatively, the price may continue to fall because of a failed auction, punishing late longs. The price may also fall back within the current range and continue to range.
As a first sign of weakness, we will observe the price spending more time between the point of control and the Value area low of the current range, and if it falls below the 4-hour order block level of $22,287. In this case, we may expect the price to dip and test the daily level of $20,673. If this level does not hold, further downward price action may be expected.

GBPJPY WEEKLY UPDATE Hi trader
The GBPJPY is still moving within the consolidation area between the lowers 155.350 and the high 162.222.
The market ended the weekend with a high of 161.802 and a low of 159.587.
Therefore, if this price goes up next week, it could break the consolidation and close at 163.
My trading strategy isn't intended to be used as a signal service. It's a process of gaining knowledge of market structure and improving my trading abilities.
Like and subscribe and happy trading to all

Bitcoin on the Edge: Trading in a Tight Range, Will it Break OutAt the time of writing, Bitcoin is still within its current range, bounded by the monthly resistance level of $23,301 and the daily support level of $22,393. We are below the Value area Low (VAL) of the current range and testing the daily support level.
For the bearish scenario: we have liquidity and stop losses along with the CME gap around the $20,000 level. It’s a significant psychological level and hard to break, but if we break through this level, we can expect a drop around $18,170-$18,540 which is a 0.66 Fibonacci level from overall lows to the current high. This level previously acted as a strong resistance.
For the bullish scenario: if the price manages to break above the $23,301 monthly level, then we can witness another $1,000 rise upwards around the $24,297 weekly level, or if the bullish momentum is strong enough, then we can expect the price to move straight to $25,211 for the swing failure pattern (SFP) or Failed auction (FA) of the last high before a significant sell-off.
Conclusion: As of now, we are in the mini range and will trade the range until it breaks. With apparent resistance and support levels, traders can identify entry and exit points to capitalize on the current market conditions.

EURJPY TRADE IDEAWaiting pullback
My trading strategy isn't intended to be used as a signal service. It's a process of gaining knowledge of market structure and improving my trading abilities.
Like and subscribe and happy trading to all

Falling Wedge- BullishAfter holding a long downtrend since the beginning of 2022, GOOG is finally looking ready to breakout here as Google is approaching the end of a nice falling wedge, testing the 20-day EMA while also hovering at a weekly low, heading into earnings.
Bollinger bands are squeezing (Not Pictured), a bullish shark harmonic pattern, and a MACD golden cross have formed on the daily timeframe. This is accompanied by a massive falling wedge on the weekly timeframe (See Attached Chart Below), along with some bullish hidden divergence on the RSI. Bullish and will be looking for a breakout from this wedge (Broader Market Conditions Permitting)- Just some support and resistance levels to watch along with some RSI-based supply and demand zones to keep an eye on in the meantime - (See Attached PT's &Charts Below)
PT1- $91.86
PT2- $92.54
PT3- $96.23
PT4- $96.23+
--Weekly Timeframe--
