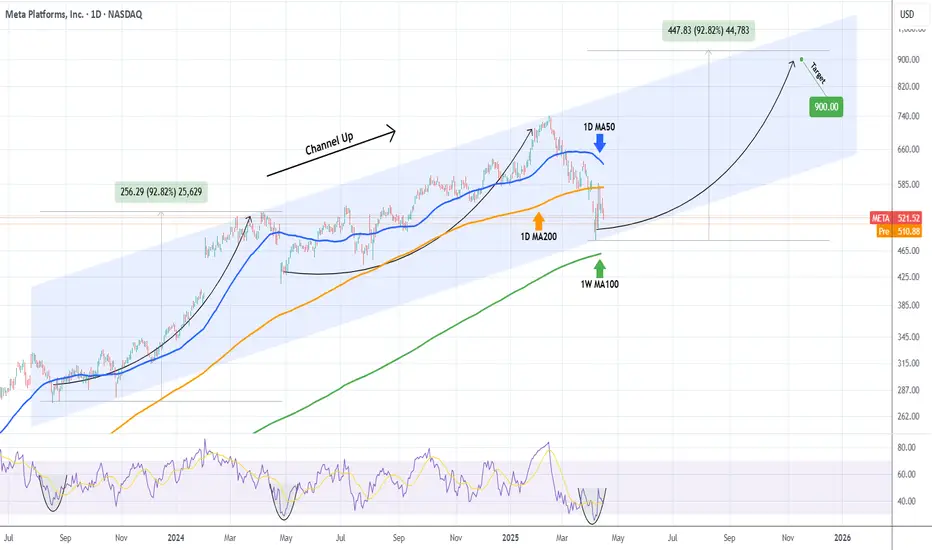
META Slow recovery but $900 possible this yearMeta Platforms (META) had a strong -35% correction in the past two months, dipping even below its 1D MA200 (orange trend-line). By doing so, it reached the bottom (Higher Lows trend-line) of the 2-year Channel Up and rebounded instantly.
The rebound has stopped so far on the 1D MA200 where it got rejected. This keeps the market neutral and the long-term bullish sentiment can only be resumed if the market breaks and closes above its 1D MA50 (blue trend-line). Until then we are neutral but only as long as the 1W MA100 (green trend-line) holds, below it the bearish trend is resumed and the correction can potentially reach -50% to -70%.
If however we close above the 1D MA50, expect a +90% rally, similar to the first Bullish Leg of the Channel Up, slow at start but aggressive after half point. Target $900.
-------------------------------------------------------------------------------
** Please LIKE 👍, FOLLOW ✅, SHARE 🙌 and COMMENT ✍ if you enjoy this idea! Also share your ideas and charts in the comments section below! This is best way to keep it relevant, support us, keep the content here free and allow the idea to reach as many people as possible. **
-------------------------------------------------------------------------------
💸💸💸💸💸💸
👇 👇 👇 👇 👇 👇
Technologyservices
MICROSOFT Channel Down bottom formation targets $440.Microsoft (MSFT) has been trading within a Channel Down since the July 05 2024 High. The stock is on its latest Bearish Leg in the past 3 months and almost completed a -17.62% decline, similar with the Bearish Leg that led to the August 05 2024 Low.
As the 1D RSI has Double Bottomed, which is what it did on the April 30 2024 Low that kick started a rally of +20.63%, we expect the stock to initiate its new Bullish Leg of the Channel. The previous one was +18.16%, so we expect a similar range and target $440.
-------------------------------------------------------------------------------
** Please LIKE 👍, FOLLOW ✅, SHARE 🙌 and COMMENT ✍ if you enjoy this idea! Also share your ideas and charts in the comments section below! This is best way to keep it relevant, support us, keep the content here free and allow the idea to reach as many people as possible. **
-------------------------------------------------------------------------------
💸💸💸💸💸💸
👇 👇 👇 👇 👇 👇

$PAYC: Can we hit another earnings LOTTO?!NYSE:PAYC : Can we hit another earnings LOTTO?!
Bought some March calls here.
Tech Services/ SaaS has been hot
🎯$227🎯$253
Not financial advice

$FROG - About to fly! 129% Upside potentialNASDAQ:FROG
As I've been calling out for the past month Tech Services and SaaS companies are the next phase of Ai and very hot right now based on the massive moves after meh to good earnings from the likes of NASDAQ:TEAM NASDAQ:MNDY NYSE:NET NASDAQ:CFLT
I believe this trend continues and this small 4B Mkt Cap company could really get going after earnings on Thursday!
- CupnHandle forming while Bull Flag breaking out
- Two year trendline is our safety net
- Massive Volume Shelf with GAP
- H5 Indicator made bullish cross and is GREEN
- WCB has formed
PTs: $43/ $57/ $67/ $84
NOT FINANCIAL ADVICE

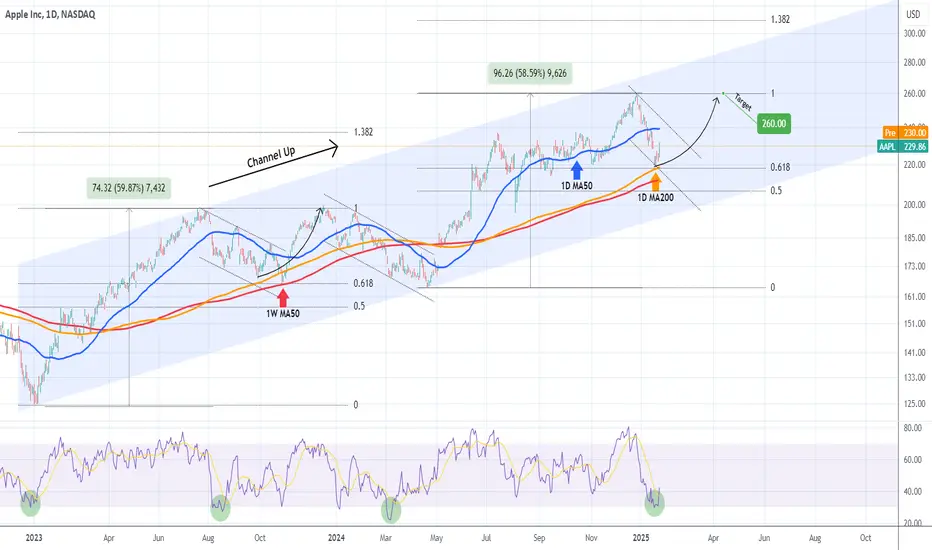
APPLE Strong buy on the 1D MA200 targeting $260.Apple Inc. (AAPL) has been trading within a 2-year Channel Up and the recent correction since the December 26 All Time High (ATH) is its technical Bearish Leg. The price posted a strong rebound yesterday following a test of the 1D MA200 (orange trend-line), the first such contact since May 08 2024.
With the 1D RSI touching the oversold barrier (30.000) and rebounding, this is technically a strong buy opportunity at least for the medium-term, as it's not a direct Higher Low of the Channel Up.
Since December already completed a +59% rise from the April 19 2024 Low, we might be having technically a medium-term rebound similar to the October 26 2023 one that re-tested the High's Resistance (at the time). As you can see both corrections have hit the 0.618 Fibonacci level.
As a result, we treat this as a solid buy opportunity to target $260.
-------------------------------------------------------------------------------
** Please LIKE 👍, FOLLOW ✅, SHARE 🙌 and COMMENT ✍ if you enjoy this idea! Also share your ideas and charts in the comments section below! This is best way to keep it relevant, support us, keep the content here free and allow the idea to reach as many people as possible. **
-------------------------------------------------------------------------------
💸💸💸💸💸💸
👇 👇 👇 👇 👇 👇
NETFLIX New Bullish Leg to $1140 has started.Netflix (NFLX) has been trading within a long-term Channel Up since the October 18 2023 Low. Every time that the price broke below and later recovered the 1D MA50 (blue trend-line), it was the most efficient buy signal of the pattern.
This is what took place yesterday, we had the first recovery above the 1D MA50 since the break below it on Jan 10. Along with the inevitable Bullish Cross below the 0.0 level on the 1D MACD (which again has been the best buy signal all these years), we expect the new technical Bullish Leg of the Channel Up to start.
So far we've had 5 core Bullish Legs and as you can see the tend to rise by roughly the same amount two at a time. The first two have been roughly +40%, then the next two +25% and the one before +38.71%. It is fair to assume that the one that has just started will be of around +38.71% too. As a result, we can place our Target a little lower for less risk and aim at $1100.
-------------------------------------------------------------------------------
** Please LIKE 👍, FOLLOW ✅, SHARE 🙌 and COMMENT ✍ if you enjoy this idea! Also share your ideas and charts in the comments section below! This is best way to keep it relevant, support us, keep the content here free and allow the idea to reach as many people as possible. **
-------------------------------------------------------------------------------
💸💸💸💸💸💸
👇 👇 👇 👇 👇 👇

TENCENT Buy signal at the bottom of the Channel Up.Tencent Holding (TCEHY) has been trading within a Channel Up since the November 15 2023 High and on Monday it made contact with the pattern's bottom (Higher Lows trend-line). As the 1D RSI turned oversold and rebounded, we believe that this is the best buy opportunity in almost 1 year.
Technically we should see the new Bullish Leg emerge now and a break above the 1D MA50 (blue trend-line) would confirm that, as it did on March 11 2024, which was only broken under again after the new Higher High was priced.
We are targeting a little below the 1.618 Fibonacci extension at $73.00.
-------------------------------------------------------------------------------
** Please LIKE 👍, FOLLOW ✅, SHARE 🙌 and COMMENT ✍ if you enjoy this idea! Also share your ideas and charts in the comments section below! This is best way to keep it relevant, support us, keep the content here free and allow the idea to reach as many people as possible. **
-------------------------------------------------------------------------------
💸💸💸💸💸💸
👇 👇 👇 👇 👇 👇

Pinterest / PINS - Idea I.hey Guys,
- Yearly Chart is bullish, Double Bottom and Engulfing Candle.
->Targets … 41 … 45 … 49.
Quarterly: Bullish Candle breakout above the Highs of Q1.
-> But it is retesting a major supply line and a yearly FIB. - creating a Grey Zone which divides the Stock into a bearish zone below and bullish zone above.
Monthly: Bullish candle - Stochastic Bullish but OB.
-> caution as we could see some Profit taking / reloading at lower prices.
3D: Signs of a possible reversal: Ascending Triangle, Fifth Wave, Diagonal Moving Stock (Distortion?)
Breakout to the upside would be extremely bullish…
Lower prices could be seen as a great buying opportunity.
targets Bears: 41 38
Targets Bulls: 45 49
Please let me know if you would like me to analyse an Instrument for you.
Thanks for reading

MICROSOFT on an excellent long-term buy level.Microsoft (MSFT) has been trading within a Channel Up since the January 06 2023 low and yesterday came to the closest 1D candle closing to the bottom (Higher Lows trend-line) of the Channel Up since September 27 2023.
That was also the last Higher Low of the Channel Up, achieved exactly on the 0.382 Fibonacci retracement level from the previous Low. With the price now below the 1D MA100 (green trend-line) but still above the 1D MA200 (orange trend-line), it appears that we are on symmetrical levels with that Higher Low.
The 1D CCI patterns between the two fractals are also similar and long-term investors can start considering buying MSFT again. Our medium-term Target is $450.00.
-------------------------------------------------------------------------------
** Please LIKE 👍, FOLLOW ✅, SHARE 🙌 and COMMENT ✍ if you enjoy this idea! Also share your ideas and charts in the comments section below! This is best way to keep it relevant, support us, keep the content here free and allow the idea to reach as many people as possible. **
-------------------------------------------------------------------------------
💸💸💸💸💸💸
👇 👇 👇 👇 👇 👇
