Trading-strategy


TOMOUSDT Hammer SignalHello, dear subscribers!
Our Autmatic Intraday Hammer Strategy revealed the potential trend reverse in TOMOUSDT price movement from the downtrend to uptrend.
Technical analysis confirmed this assumption. We can notice that the price is in the upward trend channel. Now price is on the support level, there is a high probability of rebounce. The Accumulation/Distribution Indicator demonstrates the weak bullish divergence: the price was in the downtrend, while the A/D value was almost at the same level. The final point of this analysis is that Stoch RSI indicates the oversold TOMO zone.
We expect the 4.5% price growth from 0.7318 to 0.7647. The alert was automatically executed by SkyRock Signals trading bot.

Here Come The Breakouts!So much going on right now, so many trades and some great profits. How do I select the best? Watch me on youtube, just search TraderCobb and subscripbe to see my full scan

4H Support / Resistance with RSI Day Trading StrategyRSI = Blue, EMA of RSI = Red.
RSI 14, EMA 45
Long Rules:
1) RSI > EMA RSI = look for long setups
2) Resistance is broken ( a new high )
3) Price rejects (pulls away) from the previous resistance
4) RSI > EMA RSI >> 50
Short Rules:
1) RSI < EMA RSI = look for short setups
2) Support is broken ( a new low)
3) Price rejects (pulls away) from the previous support
4) RSI < EMA RSI << 50
I typically like to place a stop loss at the top of the closest resistance (if going short) and at the bottom of the closest support (if going long) and TP 1:1.
Another method is to go for partial profit at the closest support/resistance and move the stop to breakeven to catch longer trades.
3/4 trade setups in the past month on AUDUSD
FLAGS:
*the setup on the 20th of March was a working short position, but the strategy is looking long.
*the setup on the 31st of March was not validated as the RSI is not > EMA of RSI

EURCHF POTENTIAL LONG 4HR I AM TAKING THIS TRADE WITH THE VIEW OF DAILY /4HRS ... SO PLS DO YOUR ANALYSIS AND TIMING IS VERY IMPORTANT

AUDUSD (Weekly Time Frame) I see a down Trend Formation being broken and then retested for an upcoming uptrend formation.
Thoughts? Opinions? Do you agree or disagree?

BTC Long signalYesterday my system gave me a BUY signal on BTC/USDT
I trust my system and will go long
Let's see what would be next, a trend change or just a short up move

GBPJPY: Case study. From start to finish. [Trading System]I am glad I (re-) found out retail traders have a losing edge, now I don't have to pretend I care about news / fundamentals moving the market like there is a secret :D
Only really important thing is getting the trend right and looking on the economic calendar at the days with a red circle next to them (unless you want a 3 ATR slippage).
Trading is cool (not really), it's like you are a detective analysing cases, and then you land on the mission area and you become a sniper carefully preparing his execution, and then bam take the shot. A detective with a snipar. Grrr!
In this case, first here are the support areas (every strategy expect maybe super short term and long term) need support at its core, well at least when it comes to currencies & hard commodities.
Requirements:
- Being aware of the high TF trend and patterns (weekly)
- Knowing what the daily trend is
- Having drawn the support areas via daily chart
- Having checked technicals, such as EW counts, fibs, trendlines, MA's etc...
- Noticing all the resistance above (low risk and buying probably gets absorbed)
- Having a plan in advance (what do I expect to happen what will I look at / look for)
- Being aware of events for the week (central bank decisions...)
- Noticing how the price is rejecting resistance ==> High probability
- Noting how far the next area of support is ==> Big reward / low risk
- Preparing your evacuation plan (targets, approximate SL mostly)
- Zooming in (look for a specific reaction to take the shot)
- Taking the shot like a boss
- Preparing for extraction (trail stop set a limit order etc)
- Running away with the tears of those that went opposite, and their money.
- Logging it all and analysing it...
Ok the list is long actually. But it's simple. When you know it all and have a few months of correct practice under your belt.
If you do not have a "strategy" / system already, note the list down, draw it if you like, add some steps / details if necessary, and follow all steps until it becomes second nature.
Every week (if you trade short term like me) review your charts and note your plan/expectations, then every day every few hours look at what the price is doing, etc.
Gets natural with time. Becomes a habit.
Having a system like this is not an option by the way.
I saw some people I think it was in prop firms they did this: they have a little paper every day where they write their expectations and plan for the day, and once the day is over (they do intraday) they note on the paper in a rectangle what happened what they did etc.
This is actually awesome.
Maybe I should do something pretty like this via trading view. Right now I use excel and screenshots.
I watch > 20 charts thought so noting my plan for each on this site might get boring, not sure how useful it would be...
I should do something more than just a few notes in excel and a post trade screenshot.
I did spend an awful amount of time on my past trades thought, the only thing I really missed was what I expected before the trade setup my general bias.

GOOG - STRONG SELL - Wave Failure - Wave Theory & FibonacciGOOG looks to be expeienceing what I would call 'wave failure' and remains a STRONG SELL!
GOOG complete Cycle Waves 1,2,3 and 4.
But, now the 5th impulse waves seems to be collapsing...
Normal Terminal points for the 5th Wave are between .382-.618
GOOG briefly touch .382 before it retreated...
NASDAQ:GOOG is a very interesting chart.
*Please see related idea for further analysis
-AB

$BTC Trading Strategy (83% Hit Rate, 46 Profit Rate, No-Repaint)83% Hit Rate, 46 profit rate, NO RE-PAINT.
0.01 BTC for full-time access. (no-time limit)
Message me your email address, so we can maintain contact.
Once you send 0.1 BTC
I will send you a tradingview chart with the indicator set-up, along with details on how I like to trade it.
If you have any questions, please comment below or message me.

BUY signal on Crude OilMy system gave me a BUY signal on Crude Oil Futures
Stop buy order on yesterday's HIGH
Good Luck

I Stand By $10,000 By Weekly CloseI said I could see $10,000 hit by weeks end as the new weekly candle opened up on Monday and I stand by that. I have been wrong before and I will be wrong again but I am a trader and I trade my keep by getting my timing right. Have a look and see what you think.

The price of copper has returned to pushThe price of copper has returned to push upward after the December collapse. This happened because of tensions between the US and China. The price rebounded after it touched the key support set at $ 2.53 in the last week of 2018, registering the minimum of the last two years. With strength recovering all the descent and returning close to the key level set at $ 3.00 an ounce. This price, for months supported it making it lateralize between it and the maximums of the period (3.20 dollars).
Technically, at this moment, the price is returning to test this area which has now become key static resistance. All the most important technical indicators in the short/medium term give the most probable scenario of breaking this level. The price could channeling again between 3.00 and $ 3.20. Furthermore, on both daily and weekly time frames, the two main EMAs have crossed to the upside. The trend reversed from downtrend to uptrend, while on monthly TF it has always been above the EMA20.
For now, therefore, analysts are in favor of a further rise, assuming the price of this raw material over 3 dollars by the end of the first half of 2019, supported also by the fundamentals of recent weeks. In fact with the Chinese and American economy with a slight recovery and without the specter of new sanctions and duties between the US and China, this commodity is destined to continue in this very short-term uptrend.

Litecoin Tradingbox / NEW StrategyHere you can pursue my Altcoin bitmex strategy. These boxes are my buy or sell zones. I mostly trade on the 15 minutes chart to really take any movement with me. We use a tight stop loss with these boxes and thus we can minimize the risk. Here you can see that these trading boxes show great value. If you are interested in this strategy, then contact me.
Your Mikl_Owl

ETHUSD LONG SHOT! Break above 200!?Pay attention to the highlighted areas for a bounce or break. Detailed explanation here:
youtu.be

XEM/BTC NEM Trading Strategy and EntryTo hold a dropping knife hurts. This chart aims at finding the zone where we pick up this coin again.
Only valid if
1. the zone is supported
2. MACD holds above zero
3. Stochastic long signal
P.S. I hate the Binance maintenence

XRP, ETH & Bitcoin All Moving WellAnd Just like that the market moves. Right now is a great time for trades to be on alert and looking for opportunities as the market gets some really nice trend action on the mid- time frames. I am really liking what I am seeing on XRP, ETH and Bitcoin and am poised to strike when the trades arrive.

Trading levels for 10/17/2018Nice comeback, the bulls took over most of the day on Tuesday, but i think the bears are getting ready around the 7420 area, there is resistance from previous structure, and we have R1 in that area as well, if price reaches that level i will be looking to take a short. In the other hand, i like S1 as a place to start some longs.
Please keep in mind that these are not trading signals, use your own analysis before taking any trades.
PLAN YOUR TRADE AND TRADE YOUR PLAN
K.R.S.

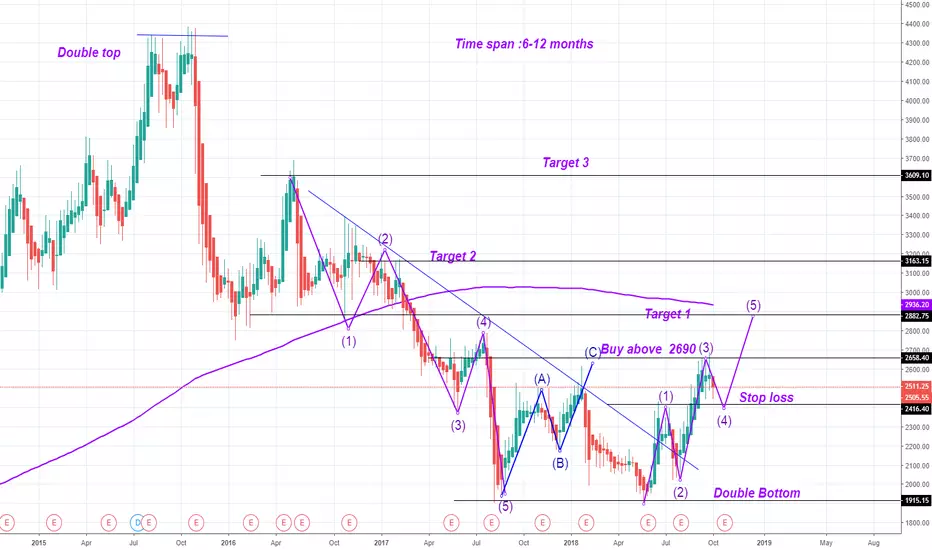
DR Reddy Lab - Possible 50-150% up side move in a YearTHe Technical shows that major trend of DR reddy is bearish and it's about a correction and about to trend reversal.
EURAUD Long Bearish Trend - RSI StrategySo end of this week has found that EURAUD bouncing of the hugely over bought 80 mark line for the RSI which means we will be imminently be reversing and heading back down. Looking forward to profiting on this one!

Trading levels for Monday 8/27/18Hey everybody here you have the levels for trading on Monday. Last friday we only had 1 break even trade. Next week we expect the market to move higher, we have 7600 as the 1.27 extension and 7650 as the 1-1 levels as well, but before trying to move to and test these levels we have to close above the ATH 7530.
Please keep in mind that these are not trading signals, use your own analysis before taking any trades.
PLAN YOUR TRADE AND TRADE YOUR PLAN
K.R.S.

Trading levels for 08/14/2018Hey everybody here are the levels for trading on Tuesday, we had a good day in the markets, a couple of divergence trades and one continuation trade as well. Moving forward, the market bounced as we expected, but it looks like the bulls are running out of steam, if the bears can take 7380 the market might be in a difficult position to continue moving higher, in the other hand a move above 7500 will probably take us to new highs.
Taking a look at ES as of right now is sitting in a decision zone, a close below the trendline will be very bad for the bulls.
Please keep in mind that these are not trading signals, use your own analysis before taking any trades.
PLAN YOUR TRADE AND TRADE YOUR PLAN
K.R.S.
