USD SGD - Short FlashcardUSD SGD - Short Flashcard
- This was more of a quad-top rather than a double top
- The high of the first leg wasn't broken all day
- You may have been stopped out on first entry if you moved stop to break even but re-entry was given so you should have caught this move
Usd-sgd

USDSGD Break-out Sell SignalPattern: Channel Down on 1W.
Signal: Bearish if a full 1W candle closes below the 1W MA50.
Target: 1.35000 (just above the Symmetrical Support Zone).
** Please support this idea with your likes and comments, it is the best way to keep it relevant and support me. **
Most recent USDSGD signal:

USDSGD a sell opportunity 🦐 The market after being in a side range between the recent lows and the 0.382 fib retracement level is now looking for a break to the downside.
Price got the rejected already twice by the Ema 21 and now bull seem to be in power on all the major usd pair.
IF the market will break below the structure at the retest of it we can set a nice short order according with our strategy.
–––––
Follow the Shrimp 🦐
Here is the Plancton0618 technical analysis , please comment below if you have any question.
The ENTRY in the market will be taken only if the condition of Plancton0618 strategy will trigger.


USDSGD a sell opportunity 🦐The price after a minor retracement broke the rising wedge and retested it.
Currently the market is moving into a bearish momentum and price crossed the Ema 21 for short.
If the market will break below at the retest the structure we can look for a nice short order according to our strategy with a 1st Tp around 1.37 area.
–––––
Follow the Shrimp 🦐
Here is the Plancton0618 technical analysis , please comment below if you have any question.
The ENTRY in the market will be taken only if the condition of Plancton0618 strategy will trigger.

USDSGD LONG TRADEUSDSGD broke downtrendline
then rebounded from demand zone at level 1.4132
Pair is in uptrend and above SMA 100
Price is based above HVN at level 1.4166 which indicates that pair is in accumulation phase
MACD shows bullish momentum
It's expected for opening long trade after exceeding resistance level at 1.4210
to target supply zone near level 1.4414

Don't miss the great buy opportunity in USDSGDTrading suggestion:
. There is a possibility of temporary retracement to suggested support line (1.4162). if so, traders can set orders based on Price Action and expect to reach short-term targets.
Technical analysis:
. USDSGD is in a range bound and the beginning of uptrend is expected.
.The price is above the 21-Day WEMA which acts as a dynamic support.
. The RSI is at 65.
Take Profits:
TP1= @ 1.4300
TP2= @ 1.4402
TP3= @ 1.4635
SL= Break below S2

USDSGD SHORT TRADEUSDSGD is in major downtrendline
Price broke key level at 1.4215
Pair is based below HVN at level 1.4239 which indicates that price is in distribution phase
MACD shows weakness in bullish momentum
It's expected to target demand zone at level 1.3873

USDSGD technically based forecast
📌Short intro:
I am full time trader - analyst * High accuracy of ideas * Technicaly and Fudnamentaly side in analysis * Comment if have any questions or want to send support * Price action - FIBO - Candl pattern * FX - STOCK - CRYPTO * Simple ideas
💡 USDSGD technicaly based idea, we can see price is bounce from supp line - trend line, 3 tops are created, candels foramtion strong bearish, technicaly indicators showing we can expect higher bearish market continuation from here.
📌Have on mind, trading involves risk, check idea on your own tactic, if have questions pls comment!
Thanks on supporting!
All best, good luck!

USDSGD - Long Term BuySetup: Weekly uptrend formed, price has retraced to the W1 38.2 fib level and expected to continue the trend to the upside. On a daily perspective, price has made a good impulse to the upside breaking above the strong and important 1.385 resistance now turned support level.
Trade: We take a long entry at the daily retracement to the broken level mentioned above (1.3850/1.3865 area), setting SL a few pips under the last H4 low and H4 61.8 fib level, while setting our TP on the weekly time frame at the anticipated new high around 1.4180

USDSGD expecting higher bulish continuation
ENTRY: 1.39150
TP: 1.39450
TP2: 1.39750
TP3: 1.40000
SL: 1.38800
Chart time frame - 4H
Time for reaching TP - 1-2D
Follow, Like, Share or Comment
Thanks on supporting!
All best!

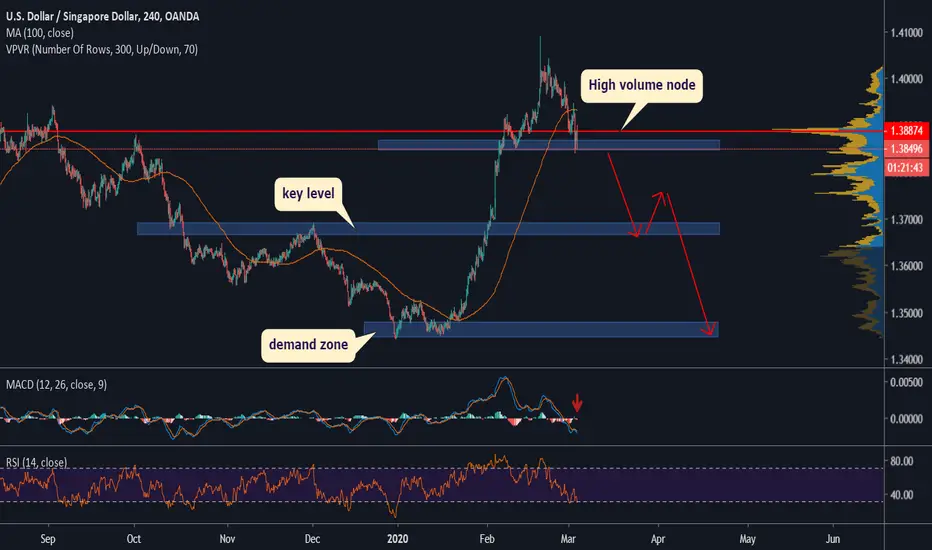
USDSGD SHORT TRADEUSDSGD now is based below HVN at level 1.3887 which indicates that pair is in distribution phase preparing for coming correction
We r waiting price breaking support level at 1.3840 for opening short trade
MACD shows bearish momentum
First target will be at key level 1.3678
Second target will be around demand zone at level 1.3447
USDSGD SHORT TRADEUSDSGD rejected from supply zone at level 1.3925
Bearish movement is confirmed with bearish engulfing candle
MACD shows bearish momentum
RSI broke uptrendline on H4 frame
It's expected for strong coming correction to retest HVN at level 1.3626
then go down towards the key level near 1.3510

USDSGD Reversal AreaWill be speculating what I understand from PA, whether its Loss in Momentum, Long Wicks with Close below, ETC. Perfect Area to look for a Short, left a few notes on the chart analysis itself to keep things brief but effective to look for incase some decide to take their own trades on this pair. Whats great about set ups like this is, if you had proper money management then if you get stopped out of trade, a bullish set up will be present and you can enter a trend continuation trade using fibonacci/exhaustion methods.

USDSGD Inverted Head and ShouldersWaiting for Price to Bounce of Resistance giving us leverage to enter in a buy with optimal risk-reward. We are in a Bullish Market, therefore looking for Retracements and Opportunities to set Long.

USDSGD COMING STRONG BEARISH WAVEUSDSGD is based below major downtrendline and key level @ 1.3513
Bullish pullback occured and rejected by Moving Avg 100
MACD shows sell signal
Coming strong bearish wave is expected

USDSGD: Long term Buy opportunity.The pair is on Higher Lows since February and as illustrated by the neutral 1M technical action (RSI = 49.129, STOCH = 50.169, ADX = 27.402, MACD = -0.001, Highs/Lows = 0.000) is on optimal buy levels. The 1D RSI has bounced already off 26.000 (oversold) and the Death Cross is emerging which last time marked the bottom. We are bullish on USDSGD with 1.38000 - 1.38300 the Target Zone.
** If you like our free content follow our profile (www.tradingview.com) to get more daily ideas. **
Comments and likes are greatly appreciated.


As we have predicted Singapore dollar has touched 1.3722, whats?After short break lets follow up our signals from last week. As we have posted earlier technical analysis for US - Singapore dollar currency pier, price has touched 1.3722 support and now correcting trend for short term. The pattern Sperandeo is still active. Check both photos

USDSGD: Sell opportunity on 1W.The pair has been strongly rejected on the 1.3800 - 1.38735 1W Resistance Zone and is declining towards the 1.3500 - 1.34450 1W Support Zone. With neutral (RSI = 52.884, STOCHRSI = 45.209, Williams = -45.866) we have an optimal medium term sell signal and our TP is 1.35000.
** If you like our free content follow our profile (www.tradingview.com) to get more daily ideas. **
Comments and likes are greatly appreciated.

daily usdsgdAs long as the price stay below 1.3820 resistance level, it will test the white trend line. If the price will cross the trend line downward, next target will be next support line which is around 1.3610 level.
We can also expect that the price can touch the main trend line (yellow) for long term expectations. White trend line is getting more important for this idea.

USDSGD: Buy opportunity on 1D.The pair is trading inside a 1D Channel Up (RSI = 65.836, MACD = 0.002, Highs/Lows = 0.0038). After breaking through the 1.36150 Resistance, which is now essentially its support, it should aim for the next sell accumulation point a 1.37450. We are long to that point.
** If you like our free content follow our profile (www.tradingview.com) to get more daily ideas. **
Comments and likes are greatly appreciated.

USDSGD: Medium term opportunity. Sell and Buy zones.The pair has been trading sideways in 2019 within the 1.36140 Resistance and 1.34450 Support. With 1D neutral (RSI = 51.626, Williams = -49.207, CCI = -45.7804, Highs/Lows = 0.0000), the price is expected to continue consolidating on the medium term within those levels. We are using 1.35750 - 1.36140 as a Sell Zone and 1.34450 - 1.34900 as a Buy Zone.
** If you like our free content follow our profile (www.tradingview.com) to get more daily ideas. **
Comments and likes are greatly appreciated.
